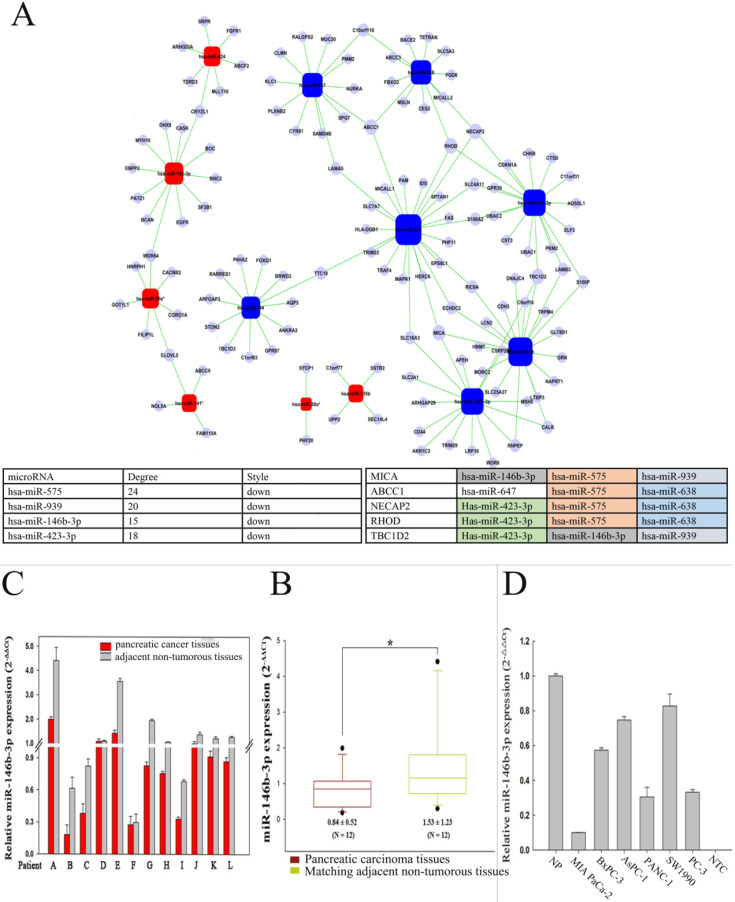
Figure 3.
Analysis of differentially microRNA between P-CSC cells and negative cells. A) MicroRNA-gene network. Squares represent microRNA nodes; circles represent mRNA nodes. Edges describe inhibitive effects of microRNA on mRNA. Red box nodes show the over-expressed microRNA-mRNA network; blue box nodes show under-expressed microRNA-mRNA network. The table on down showed the key microRNAs and the key target genes detected aberrant by the gene-wild microarrays in P-CSCs. B) Relative miR-146b-3p expression levels in 12 pairs of pancreatic cancer tissues and matched normal pancreatic tissues by real time PCR. C) The data for miR-146b-3p expression was analyzed using the Mann-Whitney U test. D) Quantitative RT-PCR analysis of relative miR-146b-3p expression levels in human pancreatic cancer cell lines compared with normal pancreatic tissues (NP). Data were normalized to U6 control.

