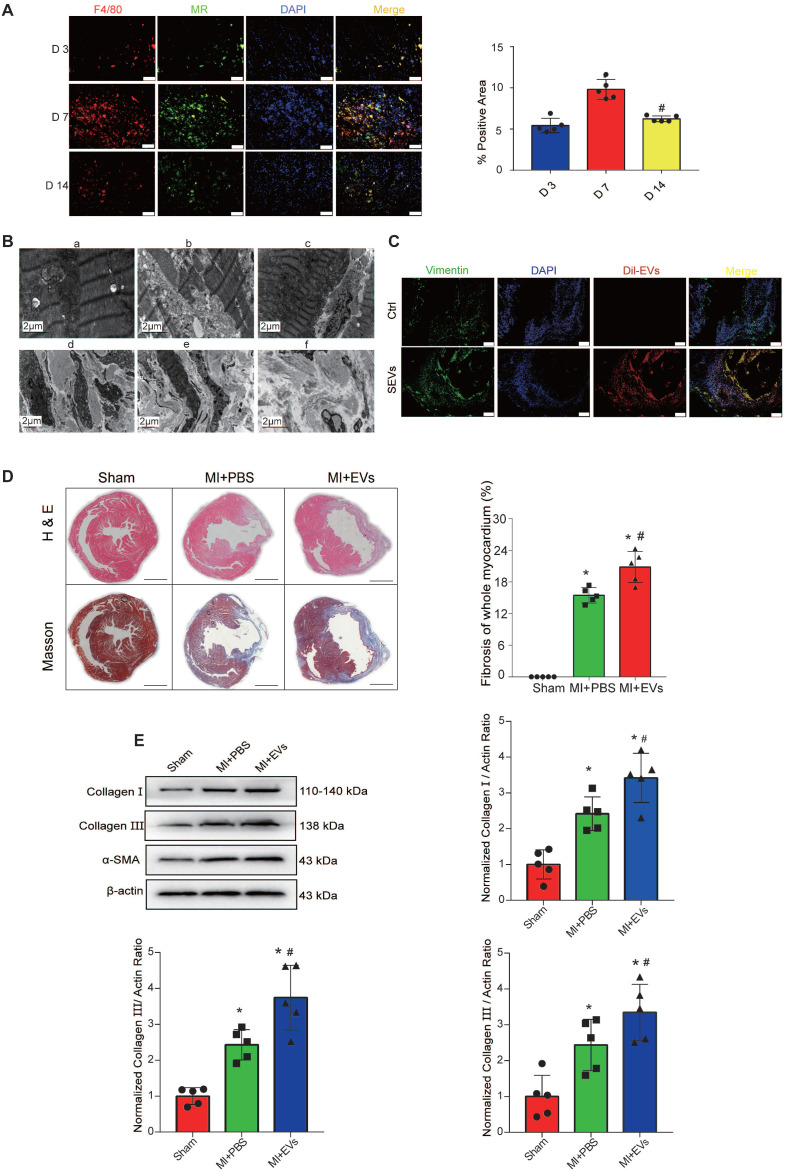
Figure 2.
M2M-derived EVs promote myocardial fibrosis. A: Representative fluorescence micrographs of M2Ms in the infarcted area on D3, D7, and D14. Scale bar = 50 μm. B: Cardiac microstructure as revealed by TEM. C: DiI-labeled M2M-EVs were injected into mice via the intramyocardial and tail vein routes for 72 h. The relative fluorescence intensity (red) was quantified to assess the uptake of EVs. Scale bar=50 μm. D: H&E and Masson's trichrome staining assays were performed to visualize the morphology of myocardial tissues from MI rats. Scale bar = 200 μm. (*P < 0.05 versus sham; #P < 0.05 versus MI + PBS; n=5 per group). E: Representative Western blots and quantification of the levels of collagen-related proteins (collagen I, collagen III, and α-SMA) in infarcted myocardial tissues treated with PBS or EVs (*P < 0.05 versus sham, #P < 0.05 versus MI + PBS; n = 3 per group).

