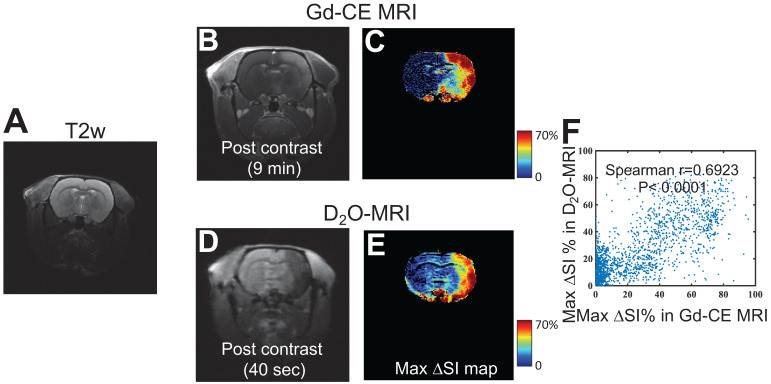
Figure 5.
Comparison of the BBB opening regions predicted by D2O-MRI and the BBB-disrupted region measured by Gd-CE MRI. A) T2w reference image. B) T1w image and c) Maximum contrast-enhancement map by Gd-CE MRI. D) T1w image and E) Maximum contrast-enhancement map by D2O. F) Correlation between the two measures. The Spearman correlation coefficient (r) was determined to be 0.6923.

