Figure 1.
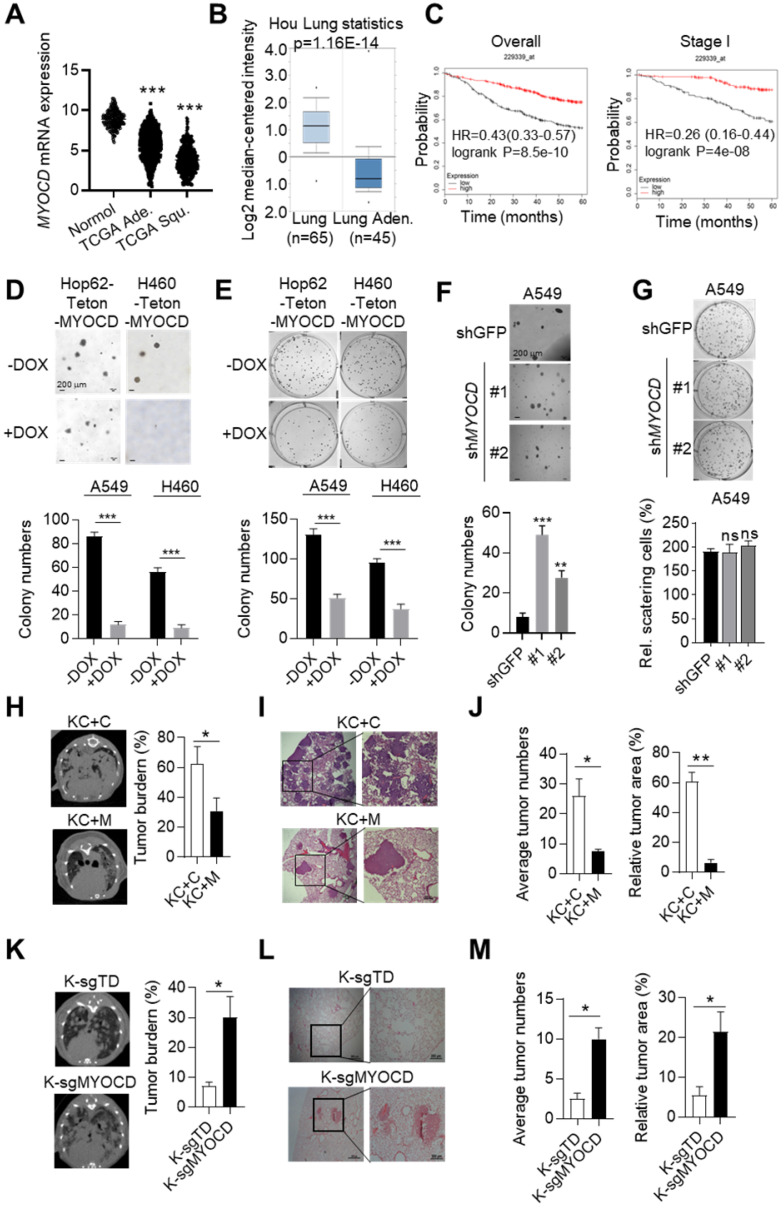
MYOCD is an essential tumor suppressor in lung cancer. (A) MYOCD mRNA expression in TCGA lung cancer tissue and GTEx lung tissue. The clinical database from UCSC Xena (http://xena.ucsc.edu/compare-tissue/) was used for analysis. (B) MYOCD mRNA expression in lung tissues and lung cancers from Oncomine database. Lung cancer expression data of Hou study was downloaded from Oncomine and used for analysis. (C) K-M survival analysis in NSCLC patients (http://kmplot.com/analysis/) (left: overall survival, right: stage I patients' survival). (D-E) MYOCD suppressed colony formation of Hop62 and H460 cell. Hop62-Teton-MYOCD (1000 cells) and H460-Teton-MYOCD cells (1000 cells) were respectively inoculated in soft agar in 6 well-plates (D) or directly in 6 well-plates (E) and treated with DOX or not treated for around 2 weeks before quantification for colonies. Statistics of colonies numbers (lower panel) and representative images (upper panel). (F) MYOCD knockdown promoted colony formation ability of A549 cells. A549 (1000 cells) were transfected with indicated shRNA plasmids for about 14 days before quantification or soft-agar colonies. Representative images of sphere assay (upper panel) and statistics of sphere formation (lower panel). (G) Effect of MYOCD knockdown on 2-D colony formation ability of A549 cells. A549 (1000 cells) were transfected with indicated shRNA plasmids for about 14 days before quantification colonies for 2-D plate. Representative images (upper panel) and statistics of colony formation (lower panel). (H) Overexpression of MYOCD slowed down the lung tumor initiation in KC mouse model. KC+C and KC+M mice were fed with DOX food for around12 weeks before CT scan. MRI images KC+C mice (n=3) and KC+M mice (n=3) of lung cancer bearing mice (left); Quantification of tumor burden (right). (I) Representative images of H&E staining of the lung tissues obtained from KC+C and KC+M mice. (J) Statistics of the average number of tumors (left) and relative tumor area (right). (K) MYOCD knockout promoted lung tumor initiation of lsl-KrasG12D mice. MRI images of lung of K-sgTD mice (n=10) and K-sgMYOCD mice (n=10) of lung cancer bearing mice (left); Quantification of tumor burden (right). (L) Representative images of H&E staining of K-sgTD and K-sgMYOCD lung tissues. (M) Quantification of average tumor numbers (left panel) and relative tumor area (right panel).

