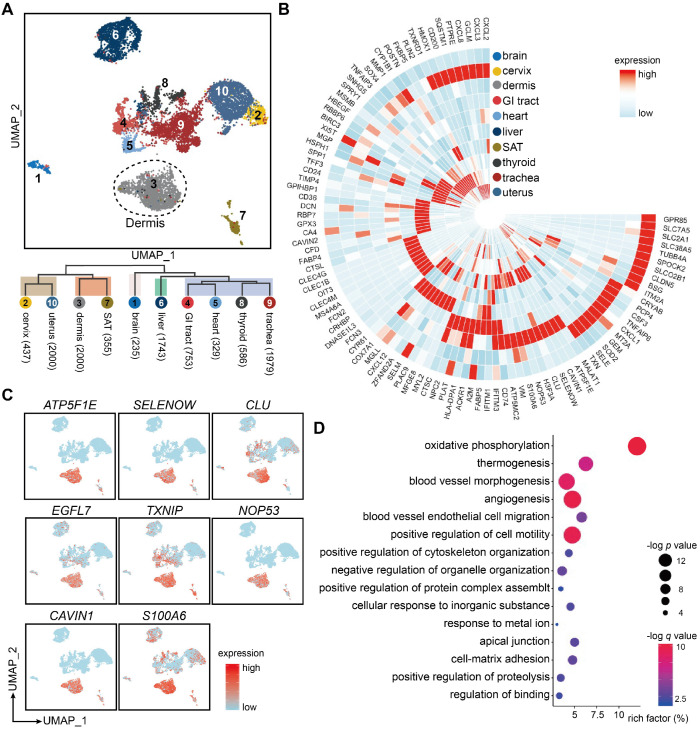
Figure 3.
Tissue-specific heterogeneity of ECs from 10 different tissues. (A) UMAP visualization of 10,417 ECs from 10 different tissues/organs with cells colored by their origin. The numbers in brackets after each tissue/organ name indicate the cell numbers in the corresponding tissue/organ. The dotted line circles ECs originated from dermis. (B) Circular heatmap of average expressions of top-10 DEGs in ECs from 10 tissues/organs. (C) Signature gene expressions of dermal ECs. (D) GO annotation enrichment analysis of DEGs in dermal ECs. x axis represents the rich factor, the circle size represents the -log p value, and the color represents the -log q value. DEGs: differentially expressed genes; ECs: vascular endothelial cells; GI: gastrointestinal; GO: gene ontology; SAT: subcutaneous adipose tissue; UMAP: uniform manifold approximation and projection.

