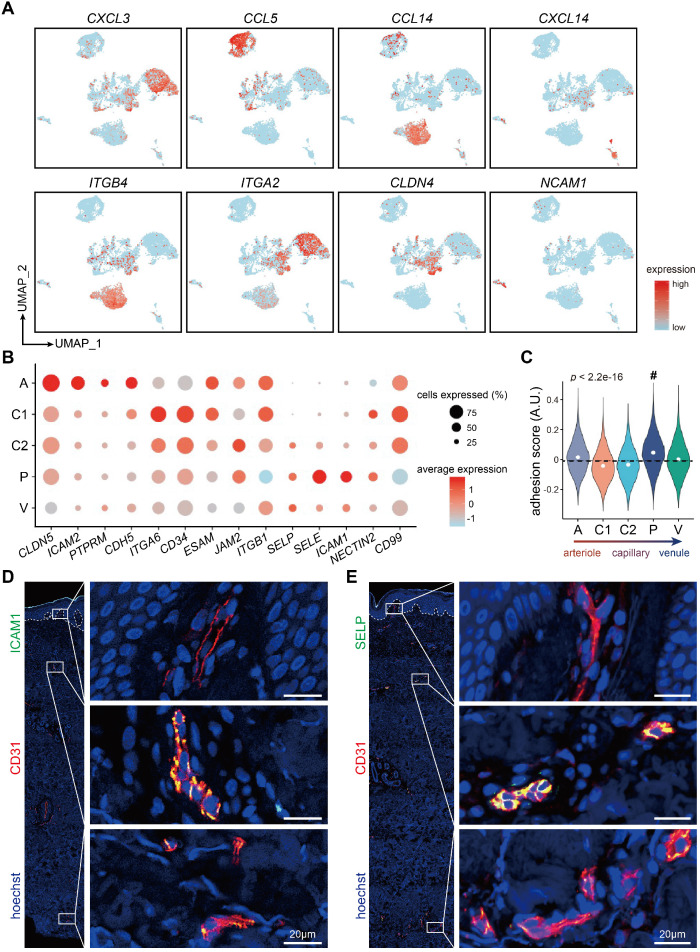
Figure 6.
Susceptible cellular adhesion site in dermal post-capillary venules. (A) Gene expressions of representative chemokines and receptors, integrins, and adhesion molecules in ECs from 10 different tissues/organs. (B) Dot plot for expressions of adhesion molecules in dermal EC subtypes. The color represents scaled average expression of adhesion molecules in each subtype, and the size indicates the proportion of cells expressing adhesion molecules. (C) Adhesion scores of cells in 5 dermal EC subtypes. The mean score is labeled with a dotted line. Cluster P with the highest score is indicated by a hash key. (D, E) Representative immunofluorescence images of ICAM1, SELP, and CD31 in human skin. Images of CD31+ ECs in superficial, intermediate, and deep plexus are zoomed in. The image is representative of 11 biological replicates (limbs, n = 4; trunk, n = 4; foreskin, n = 3). The white dotted line marks the interface between epidermis and dermis. Scale bars represent 20 µm. Cluster A: arteriole ECs; Cluster C1, C2: capillary ECs; Cluster P: post-capillary ECs; Cluster V: venule ECs. A.U.: arbitrary unit; ECs: vascular endothelial cells; UMAP: uniform manifold approximation and projection.

