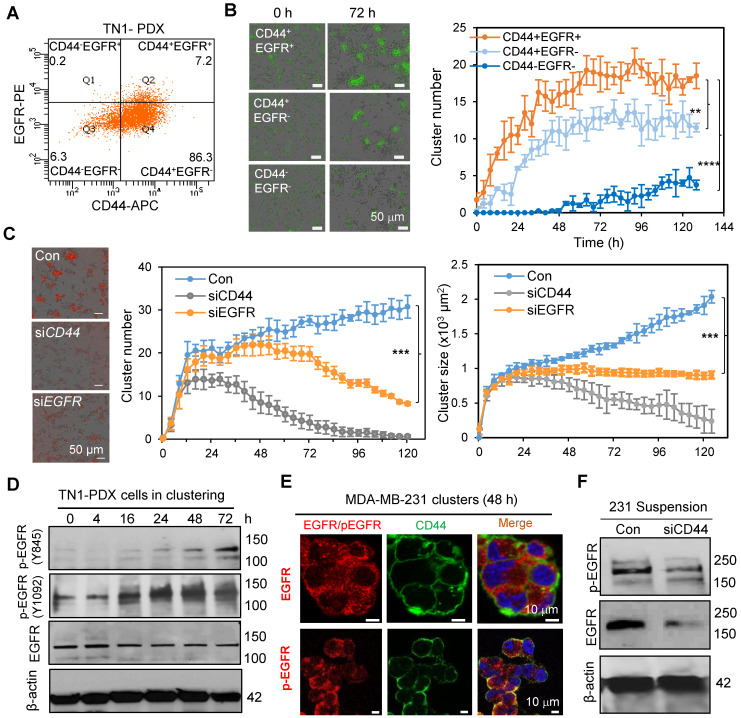
Figure 2.
EGFR enhances CD44 mediated tumor cell clustering. A. Flow dot plot of CD44 and EGFR expression in TN1 PDX tumor cells. B. Clustering images (left panels) and curve analyses (right panel) of tumor cells (CD44+EGFR+, CD44+EGFR-, and double negative) sorted from L2G-TN1 PDXs. C. Clustering images (left panels) and curve analyses (right panels) of tumor cells from L2T-TN1 PDXs transfected with siRNA control (Con), siCD44, or siEGFR during clustering assays. D. Immunoblots of EGFR and phospho-EGFR (Y845 and Y1092) and β-actin (loading control) in TN1 PDX tumor cells at the indicated time points between 0 and 72 h of the clustering assay. E. Images of immunofluorescence staining of MDA-MB-231 cells in suspension for EGFR or pEGFR (Y845, red) and CD44 (green) with Dapi (blue)-stained nuclei. F. Immunoblots of phospho-EGFR (Y845) and total EGFR in MDA-MB-231 cells in suspension for 48 h after transfection with scramble control (Con) or siCD44.

