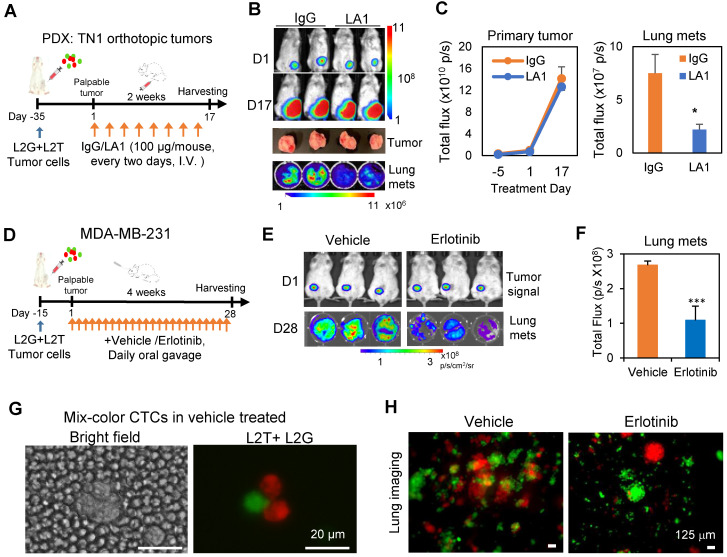
Figure 5.
Inhibition of EGFR blocks spontaneous metastasis. A. Timeline of tumor inoculation and LA1 treatment after palpable tumor formation in PDX model TN1. B. Bioluminescence images of tumor cells orthotopically implanted at the left 4th mammary fat pat on day 1 (D1) , or 17 (D17) of the treatment (top panels), harvested tumors (regular photo, middle panel), and lung metastases (bottom panel). C. Tumor growth curve (left panel) and bar graph of lung metastases (mets, right panel) showing comparable IgG and LA1-treated primary tumor signals over time (not significant) but reduced lung mets (one-tailed t-test *p = 0.05). D. Timeline of tumor inoculation and erlotinib treatment after palpable tumor formation with orthotopically implanted MDA-MB-231 cells. E. Bioluminescence images of tumors on Day 1 (D1) (top panels) and lung metatases (mets) on Day 28 (D28) after treatment with vehicle or 50 mg/kg erlotinib (daily orally) for 4 weeks (bottom panels). F. Bioluminescence signal (total flux) histograms of the lungs from vehicle and erlotinib-treated breast tumor-bearing mice as shown in E. G. Representative mixed-color tumor cell clusters in blood from tumor-bearing mice treated with vehicle or erlotinib. H. Fluorescence images of dissected lungs from tumor-bearing mice treated with vehicle or erlotinib.

