Figure 1.
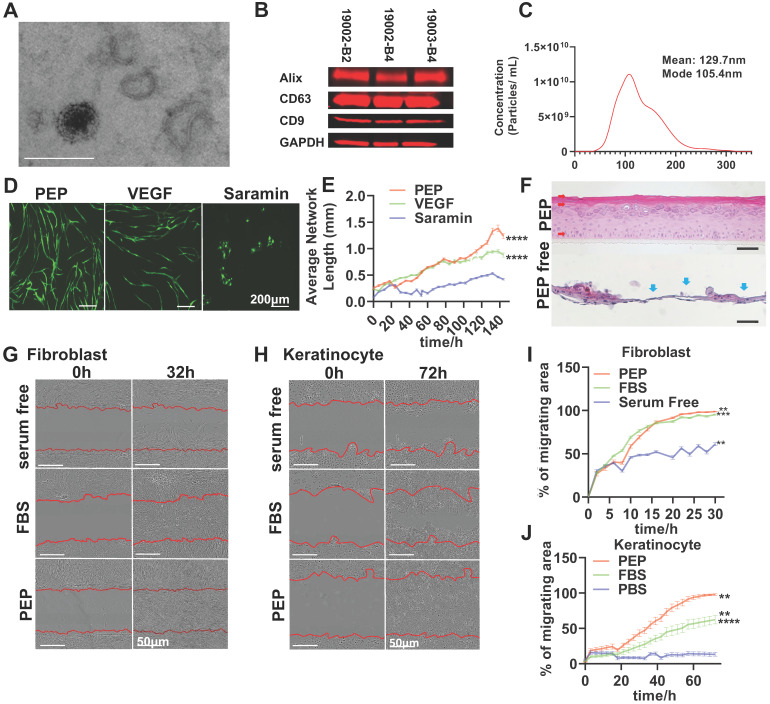
PEP displays exosomal characteristics and drives in vitro activities of skin progenitors. (A): Representative transmission electron microscope image for PEP exosomes. (Scale; 1 bar represents 200 nm). (B): Western blot analysis for the expression of CD63, CD9 and Alix on PEP exosomes from three separate current good manufacturing practices lots. Total protein staining was used as a loading control validated by GAPDH probing. (C): Size distribution of PEP exosomes obtained using NTA (NanoSight). The exosomes were averagely 129.4 nm wide. (D): In vitro angiogenesis assay using co-culture of human dermal fibroblast (hFB) with GFP-tagged human umbilical vascular endothelial cells (HUVEC) in presence of VEGF, PEP or Suramin. (E): Quantification of average network length in 6 hours increments over a 6 day period. (F): Organoid differentiation assay of human keratinocytes treated PEP or serum free media at day 24. H&E staining was performed to all the groups. Red arrow: Organized differentiated keratinocyte with multiple epidermis-like layers. Blue arrow: unorganized keratinocytes differentiation. (G): Scratch assay evaluating the migration of primary rabbit dermal fibroblast treated with FBS, PEP or serum free media. Representative pictures of wound closure for FBS vs. PEP vs. serum free media at 0 h and 32 h. (H): Scratch assay testing the migration of human keratinocytes treated with FBS, PEP or PBS. Representative pictures of wound closure for FBS vs. PEP vs. PBS at 0hr and 72 h. (I): Graph showing quantification of fibroblast wound closure, performed every 2 h over a 32 h period. (J): Graph showing quantification of keratinocytes wound closure, performed every 3 h over a 72 h period. Scale bar in A&D: 200 µm, Scale bar in B&C: 50 µm. N= 8 in D-J, 2-tailed paired Student's t test for each group compared with control group. ***p < 0.001, ****p < 0.0001.

