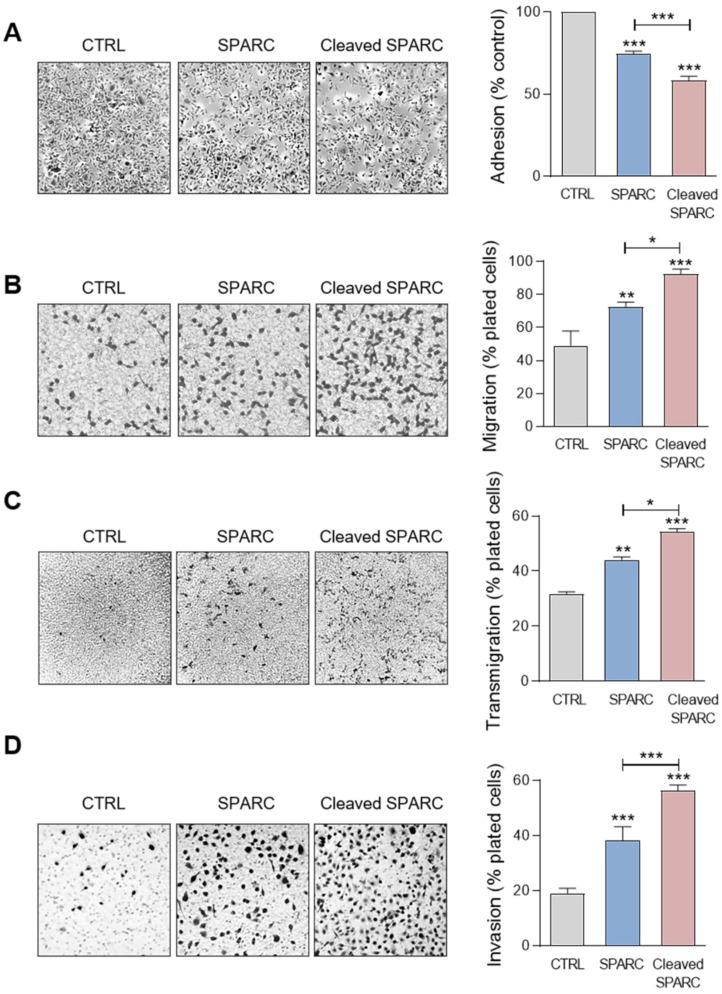
Figure 6.
Effects of FL SPARC and cath-D-induced cleaved SPARC fragments on adhesion, migration, transmigration and invasion of TNBC cells. (A) Cell adhesion. MDA-MB-231 cells were let to adhere for 30 min on a fibronectin matrix in the absence or presence of recombinant FL SPARC (SPARC), or recombinant cath-D-induced cleaved SPARC fragments (cleaved SPARC) at the final concentration of 240 nM. Left panels, representative images of adherent cells. Right panel, adherent cells were stained with crystal violet, and adhesion was quantified at 570 nm. CTRL, PBS in cleavage buffer. Data are the mean ± SD (n = 3); ***, p < 0.001, ANOVA and Bonferroni's post hoc test. Similar results were obtained in four independent experiments. (B) Cell migration. MDA-MB-231 cells were let to migrate for 16 h on a fibronectin matrix in the absence or presence of recombinant FL SPARC, or cleaved SPARC at a final concentration of 240 nM. Left panels, representative images of migrating cells. Right panel, migrating cells were quantified by MTT staining and absorbance was read at 570 nm. CTRL, PBS in cleavage buffer. Data are the mean ± SD (n = 3); *, p < 0.05; **, p < 0.01; ***, p < 0.001, ANOVA and Bonferroni's post hoc test. Similar results were obtained in three independent experiments. (C) Endothelial transmigration. MDA-MB-231 cells were let to transmigrate for 16 h through a HUVEC monolayer in the absence or presence of recombinant FL SPARC, or cleaved SPARC at a final concentration of 240 nM. Left panels, representative images of transmigrating cells. Right panel, transmigrating cells were stained with MTT and quantified at 570 nm. CTRL, PBS in cleavage buffer. Data are the mean ± SD (n = 3); *, p < 0.05, **, p < 0.01, ***, p < 0.001, ANOVA and Bonferroni's post hoc test. Similar results were obtained in two independent experiments. (D) Cell invasion. MDA-MB-231 cells were let to invade for 16 h on a Matrigel matrix in the absence or presence of recombinant FL SPARC, or cleaved SPARC at a final concentration of 240 nM. Left panels, representative images of invading cells. Right panel, invading cells were stained with MTT and quantified at 570 nm. CTRL, PBS in cleavage buffer. Data are the mean ± SD (n = 3); ***, p < 0.001, ANOVA and Bonferroni's post hoc test. Similar results were obtained in three independent experiments.

