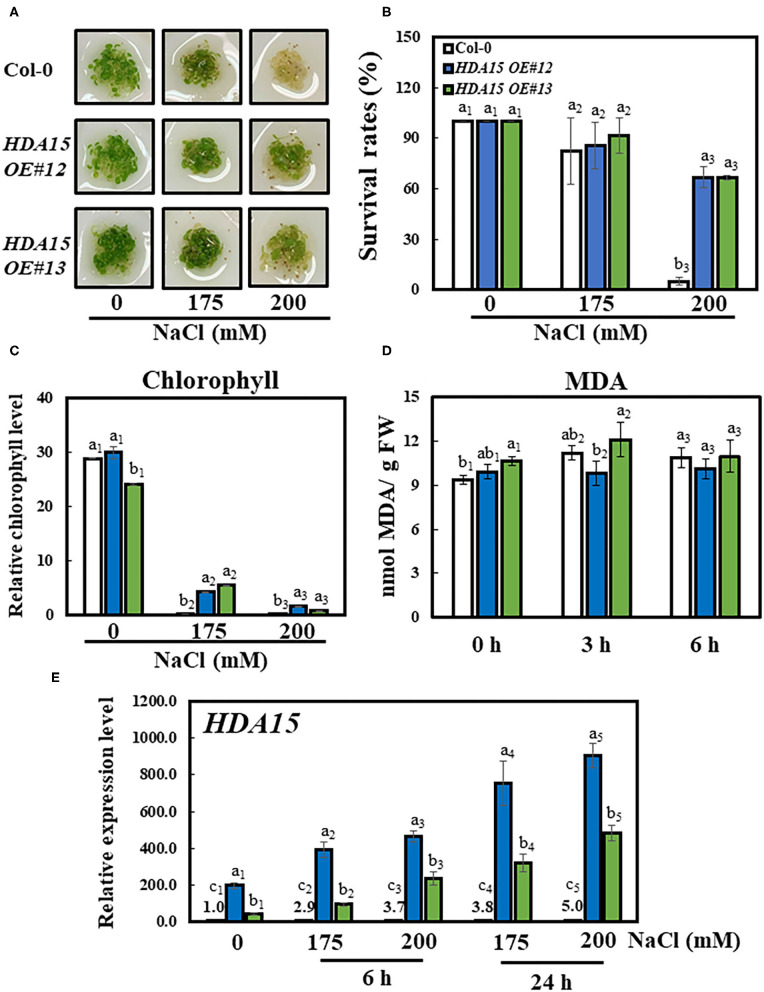
Figure 3.
Growth performance of HDA15 transgenic plants, survival rates, and chlorophyll content in response to salt stress. Four-day-old plants, which were germinated in normal MS media, were transferred to different NaCl concentrations as indicated. The experiment was repeated three times independently to obtain a consistent result. (A) Phenotypes of Col-0 and HDA15 OE transgenic plants following a 3-day exposure to salt stress. (B) The survival rates of Col-0 and HDA15 OE transgenic plants following a 3-day exposure to salt stress. (C) Chlorophyll levels of Col-0 and HDA15 OE transgenic plants following a 3-day exposure to salt stress. (D) The lipid peroxidation levels of Col-0 and HDA15 OE plants in response to salt stress. Seven-day-old plants, which were germinated in normal MS media, were transferred to 150 mM NaCl for 0, 3, and 6 h. (E) HDA15 expression in Col-0 and HDA15 OE plants. Seven-day-old plants were exposed to 175 and 200 mM NaCl for 6 and 24 h, followed by RNA extraction and cDNA synthesis for qRT-PCR. Actin2 was used as an internal control. Error bars represent the standard deviation of three replicates. Different letters (a, b, or c) within a treatment group indicate significant differences based on one-way ANOVA (P < 0.05).

