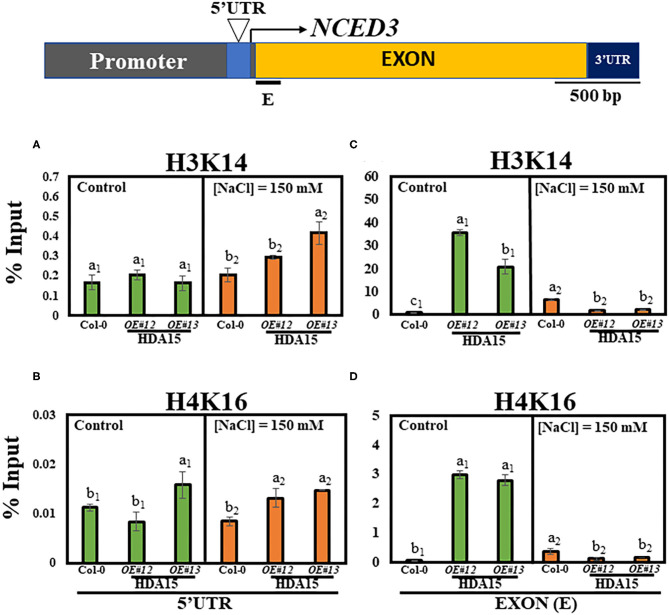
Figure 7.
H3K14 and H4K16 levels in Col-0 and HDA15 OE transgenic plants in response to salt stress. Two-week-old plants were subjected to 150 mM salt stress for 6 h. The samples were then used for chromatin immunoprecipitation (ChIP) assay. Immunoprecipitated DNA was analyzed via qRT-PCR. (A) H3K14 levels at 5′UTR of NCED3 promoter under normal and salt stress conditions. (B) H4K16 levels at 5′UTR of NCED3 promoter under normal and salt stress conditions. (C) H3K14 levels at NCED3 exon under normal and salt stress conditions. (D) H4K16 levels at NCED3 exon under normal and salt stress conditions. Error bars represent the standard deviation of three replicates. Different letters (a, b, or c) within a treatment group indicate significant differences based on one-way ANOVA (P < 0.05).

