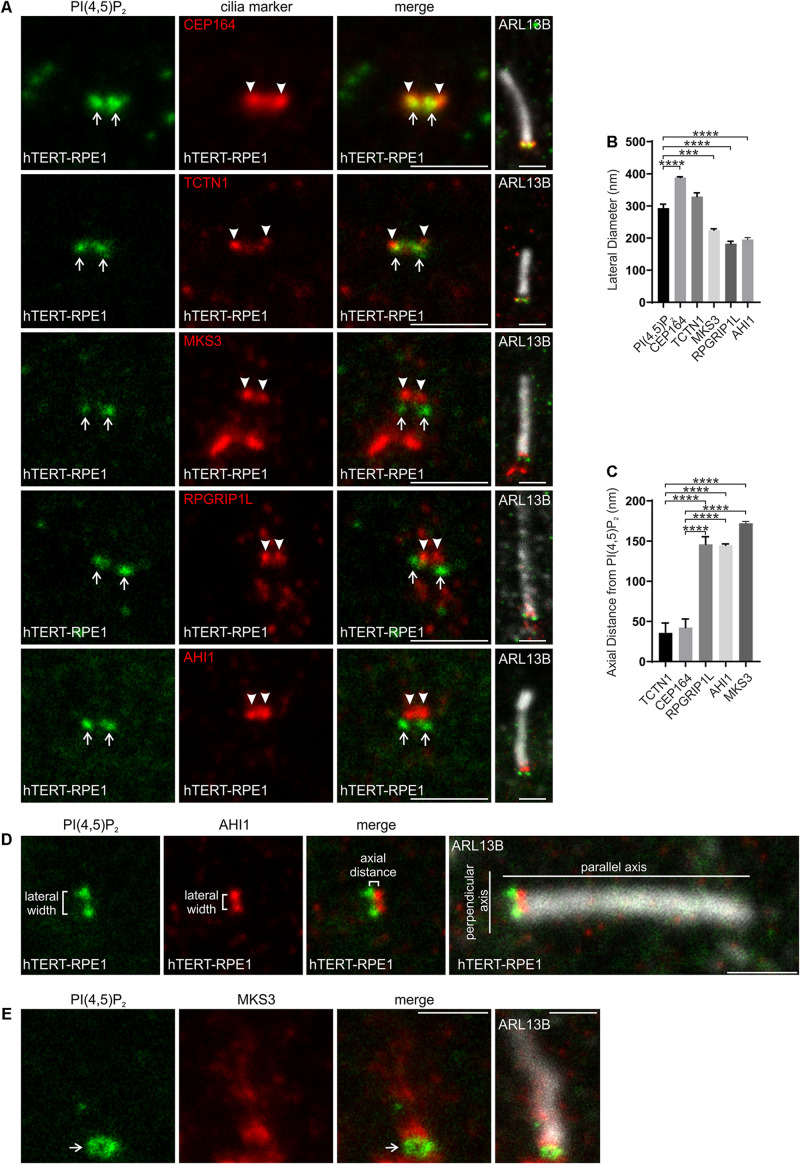
FIGURE 2.
PI(4,5)P2 localizes to a specific subdomain of the transition zone. (A) Ciliated hTERT-RPE1 cells were immunostained with PI(4,5)P2 (green), ARL13B (grayscale) and CEP164, TCTN1, MKS3, RPGRIP1L or AHI1 (red) antibodies and imaged by STED microscopy (confocal resolution image of the ARL13B stained axoneme is shown). Right panels show merged image at lower magnification. Arrows indicate transition zone PI(4,5)P2 signals, arrow heads indicate transition zone protein localization, bar indicates 1 μm. (B) Graph shows the lateral diameter between the highest intensity points of the PI(4,5)P2 or cilia protein marker puncta perpendicular to the plane of the axoneme. Bars represent mean ± SEM, n = 3 independent experiments, ≥30 cilia imaged per experiment and all cilia with two distinct PI(4,5)P2 or cilia marker protein puncta measured, statistical significance was determined using one-way ANOVA (p < 0.0001) followed by Tukey’s post hoc test ***p < 0.001, ****p < 0.0001. (C) Graph shows the axial distance between the highest intensity point of the PI(4,5)P2 signal and each cilia marker protein signal parallel to the plane of the axoneme. Bars represent mean ± SEM, n = 3 independent experiments, ≥ 30 cilia imaged per experiment and all cilia with distinct PI(4,5)P2 or cilia marker protein puncta measured, statistical significance was determined using one-way ANOVA (p < 0.0001) followed by Tukey’s post hoc test, ****p < 0.0001. (D) Representative image showing the method used for lateral diameter and axial distance measurements, bar indicates 1 μm. (E) Ciliated hTERT-RPE1 cells were immunostained with PI(4,5)P2 (green), MKS3 (red) and ARL13B (grayscale) antibodies and imaged by STED microscopy (confocal resolution image of the ARL13B stained axoneme is shown). Right panel shows merged image at lower magnification. Arrow indicates ring shaped transition zone PI(4,5)P2 morphology, bar indicates 1 μm.

