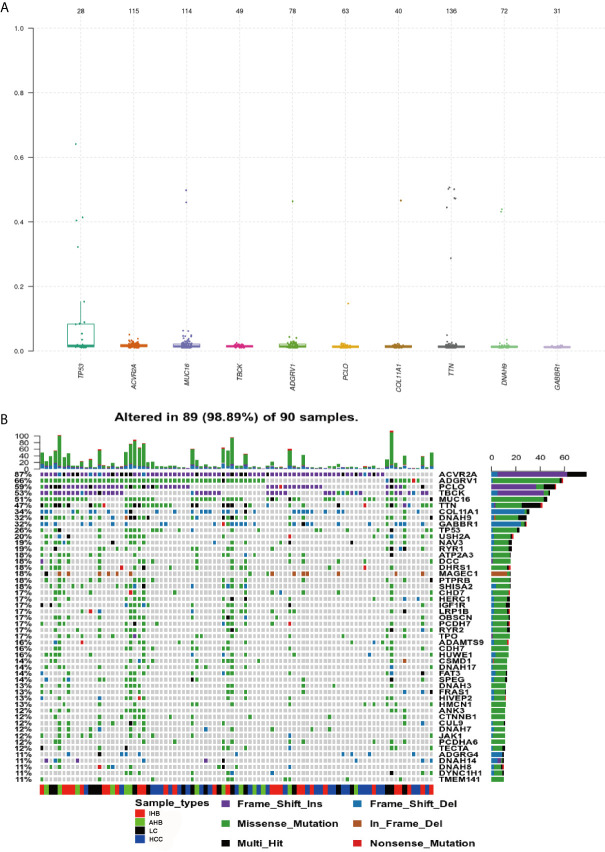
Figure 3.
Genomic Profiling of frequently mutated genes and their corresponding mutations identified in plasma samples. (A) Top frequent mutated genes identified in plasma samples. A plot of variant allele frequencies as y-axis, top frequent mutated genes as x-axis to estimate the clonal status of top mutated genes. (B) Genomic Profiling of mutations in frequently mutated genes identified in plasma samples. Different colors of squares represent different types of mutations in the graph. Patient identification numbers are listed at the bottom of the graph. Sample types were divided by different colors of squares on the bottom of the graph. The number of patients having a certain mutation is represented by the bar on the right. The number of mutations that each patient has is represented by the bar on the top of the graph.

