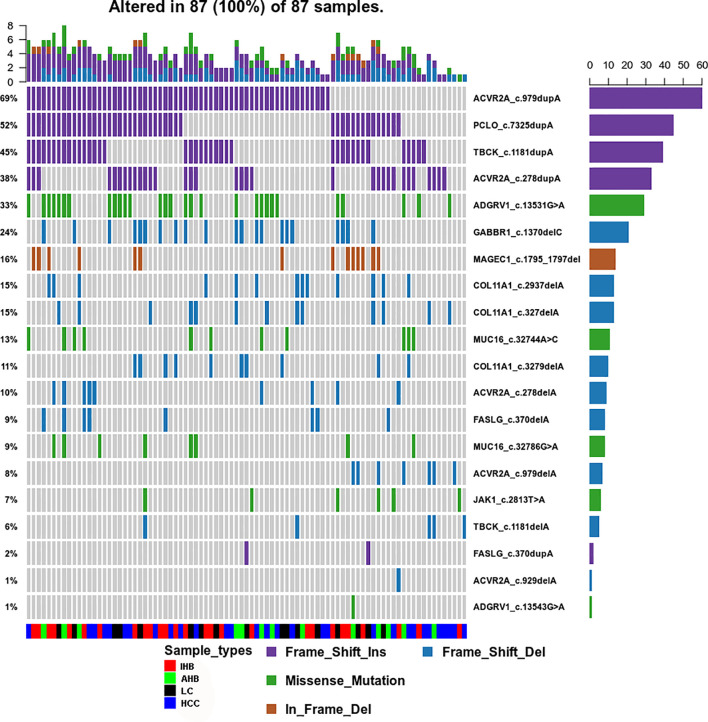
Figure 5.
Common Mutation Spectrum of point coding variants identified in AHB, IHB, LC and HCC patients. Different colors of squares represent different types of mutations in the graph. Patient identification numbers are listed at the bottom of the graph. Sample types were divided by different colors of squares on the bottom of the graph. The number of patients having a certain mutation is represented by the bar on the right. The number of mutations that each patient has is represented by the bar on the top of the graph.

