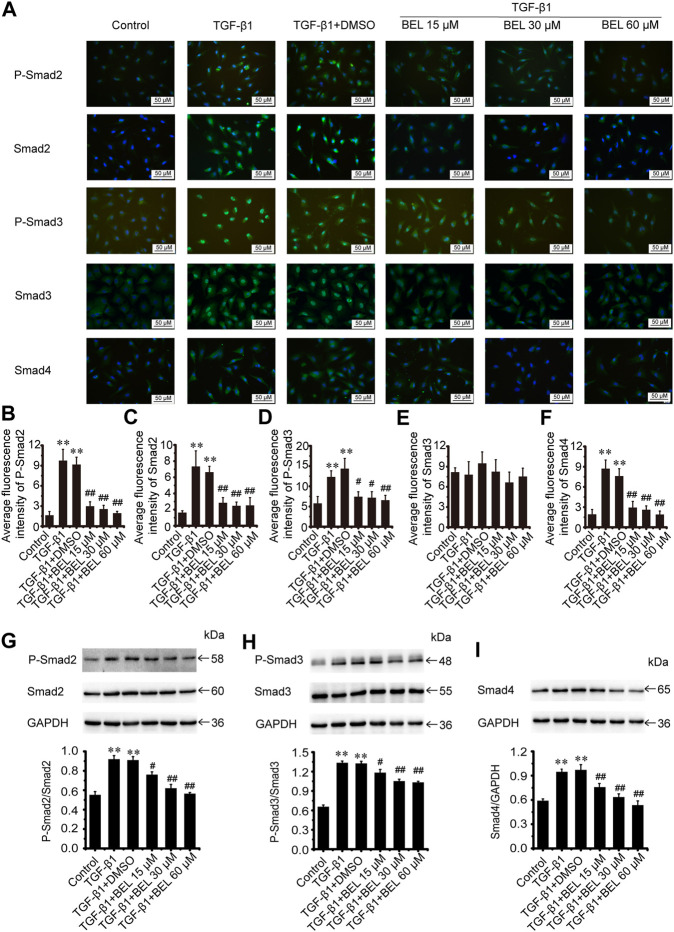
FIGURE 7.
BEL inhibits Smads signaling in CFs (A) The effects of different doses of BEL (15, 30, 60 μM) on the expression of Smads2, 3, and 4 and the level of P-Smads2, 3 induced by TGF-β1 using immunofluorescence staining. Cell nuclei was counterstained in blue with DAPI (B–F) Bar graphs show quantitative analyses of fluorescent signals for P-Smads2, Smads2, P-Smads2, Smad3, and Smad4 (G–I) Western blotting detects Smad proteins expression and phosphorylation levels. Bar graphs show fold changes of P-Smad2/Smad2, P-Smad3/Smad3, and Smad4/GAPDH (n = 3). Data were shown as mean ± SEM. **p < 0.01 vs. control, # p < 0.05 vs. TGF-β1, ## p < 0.01 vs. TGF-β1.

