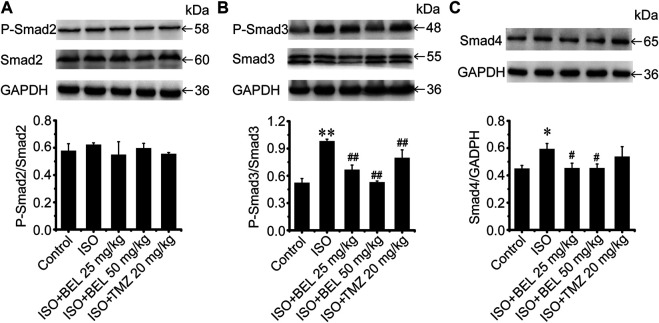
FIGURE 8.
BEL regulates Smad proteins expression and phosphorylation in vivo (A–C) Western blotting analysis of Smads2, 3, 4 expression and Smads2, 3 phosphorylation levels. Bar graphs show fold changes of P-Smad2/Smad2, P-Smad3/Smad3 and Smad4/GAPDH (n = 3). Data were shown as mean ± SEM. *p < 0.05 vs. control, **p < 0.01 vs. control, # p < 0.05 vs. ISO, ## p < 0.01 vs. ISO.

