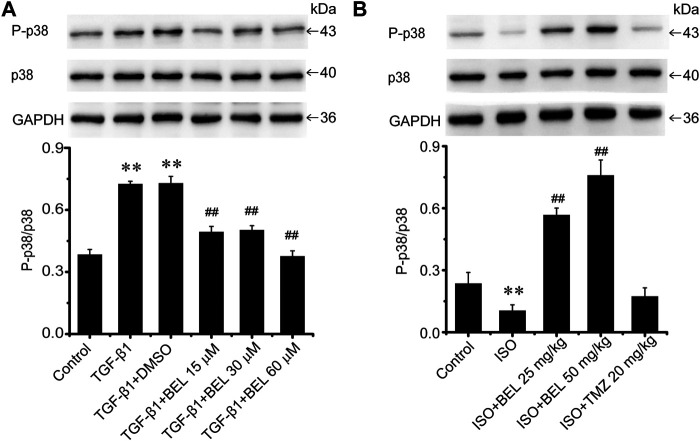
FIGURE 9.
The effects of BEL on p38 signaling in vitro and in vivo (A) The effects of different doses of BEL (15, 30, 60 μM) on the expression p38 and the level of P-p38 in CFs induced by TGF-β1 using western blotting. Bar graphs show fold changes of P-p38/p38 (n = 3). Data were shown as mean ± SEM. **p < 0.01 vs. control, ## p < 0.01 vs. TGF-β1 (B) The effects of BEL on the expression p38 and the level of P-p38 in vivo by western blotting. Bar graphs show fold changes of P-p38/p38 (n = 3). Data were shown as mean ± SEM. **p < 0.01 vs. control, ## p < 0.01 vs. ISO.

