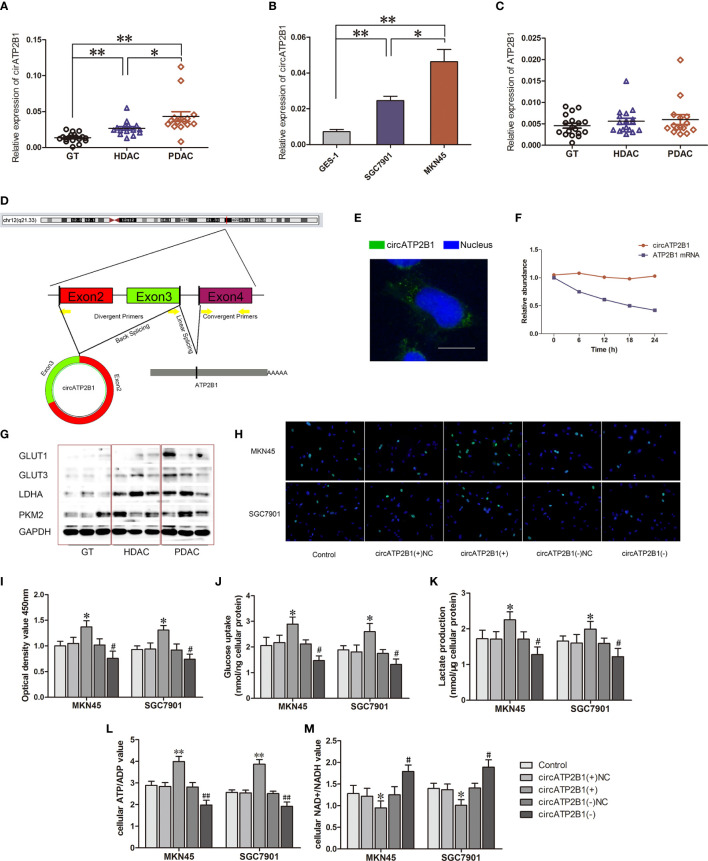
Figure 1.
Identification and charactorization of circATP2B1 in gastric cancer tissues and cells. (A). Relative expression of circATP2B1 in normal gastric tissues (GT), highly differentiated adenocarcinoma cancer (HDAC) and poorly differentiated gastric adenocarcinoma cancer (PDAC) specimens. (B). Relative expression of circATP2B1 in gastric cancer cell lines MKN45 and SGC7901 as well as GES-1. (C). Relative expression of ATP2B1 mRNA in GT, HDAC and PDAC specimens. (D). Schematic illustration showing the genomic loci of ATP2B1 gene and circATP2B1 derided from exons 2 and 3 of ATP2B1. (E). Fluorescence hybridization in situ (FISH) assay showed the localization of circATP2B1 in cell. The circATP2B1 probe was labeled with FITC (green). Nucleus was stained with DAPI (blue). The image was taken at 1,000× magnification. The scale bar represented 10 μm. (F). Actinomycin assay was performed to evaluate the stability of circATP2B1 and ATP2B1 mRNA in MKN45 cell. (G). Expressions of glycolysis-related proteins GLUT1, GLUT3, LDHA, PKM2 in GT, HDAC and PDAC. (H). EdU incorporation assay and (I) CCK8 Cell proliferation assay in circATP2B1(+) and circATP2B1(−) cells. (J). The glucose uptake assay (K) lactate accumulation and (L) ATP/ADP ratio (M) NAD+/NADH ratio of MKN45 and SGC7901 cell lines stably overexpressing or knockdown of circATP2B1. (Data represented means ± SD, n=3, *P < 0.05, **P<0.01, # P < 0.05, ## P < 0.01 compared with circATP2B1(-)NC group).

