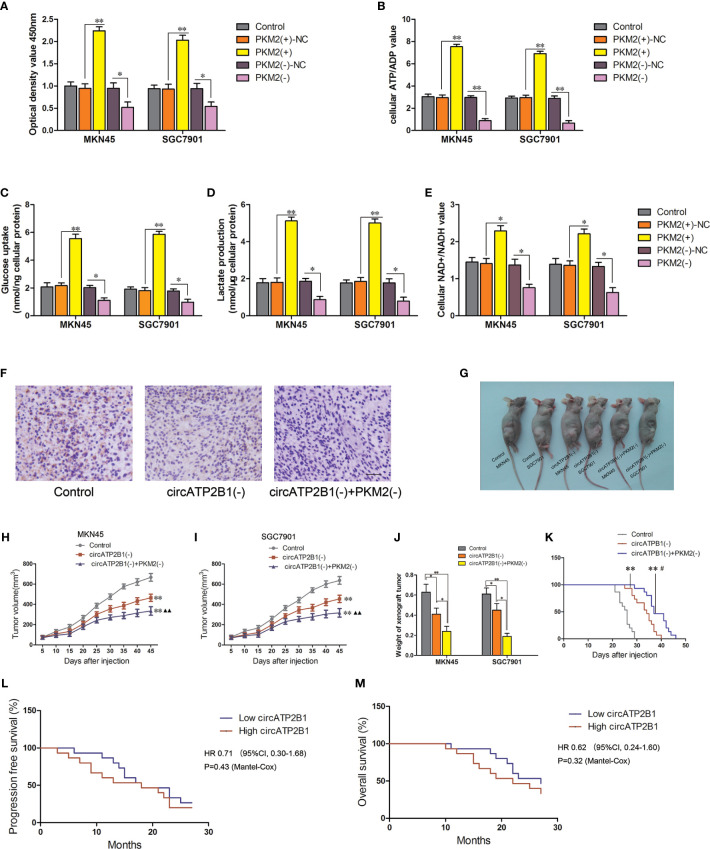
Figure 6.
PKM2 knockdown combined with circATP2B1 knockdown play synergistic anti-tumor effect in vivo. (A). CCK8 assay conducted for cell viability in PKM2(+) and PKM2(−) groups. (B). The glucose uptake assay (C) lactate accumulation and (D) ATP/ADP ratio (E) NAD+/NADH ratio of MKN45 and SGC7901 cell line which was over-expressing or silencing of PKM2. (*P <0.05, **P <0.01). (F). IHC staining image of ki67 in the subcutaneous xenograft. It revealed the protein level of ki67 in different groups. Images were photographed at 400× magnification. The scale bar represented 50 μm. (G). The nude mice carrying tumors from representative groups were shown (n = 7). (H, I). Tumor growth curves of three groups in nude mice. Tumor growth was monitored for up to 45 days. ** P <0.01 vs. control group, ▲▲ P <0.01 vs.circATP2B1(−) group. (J). Xenogarft tumor weight of three groups in nude mice (*P <0.05, **P <0.01). (K). Kaplan–Meier curves for nude mice xenograft module (**P <0.01 vs Control group, # P <0.05 vs circATP2B1(−) group). (L) Progression free survival and (M) overall survival for patients with different circATP2B1 expression levels.

