FIGURE 1.
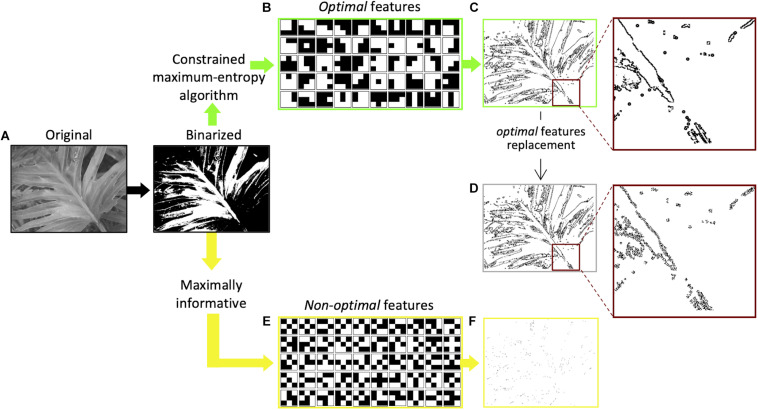
Extraction of optimal and non-optimal features and examples of sketches. (A) Original versions of natural images (Olmos and Kingdom, 2004) were first digitized into black and white. (B) Set of 50 3 × 3-pixels optimal features extracted by applying to black and white images the constrained maximum entropy model (Del Viva et al., 2013). (C) Sketch obtained by filtering the image with features in (B). All the optimal features are positioned along image contours, as shown in the inset. (D) Sketch obtained by replacing in (C) the optimal features with non-optimal features (Del Viva et al., 2016). The spatial structure of the features along the contours does not correspond to the orientation of the contour, as shown in the inset. (E) A set of 50 3 × 3-pixels non-optimal features with the lowest probability in the statistical distribution of all possible 3 × 3-pixel black and white features. (F) Sketch obtained by filtering the digitized image with the 50 features in (E).

