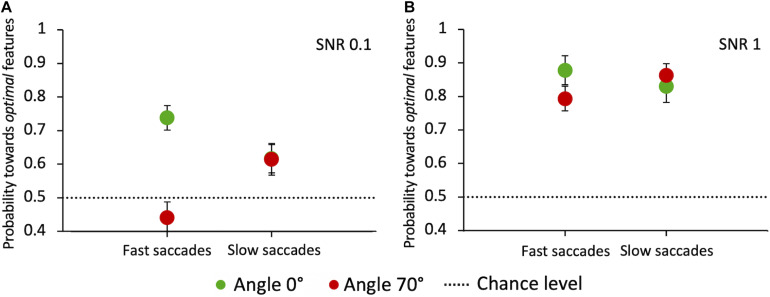
FIGURE 11.
Probability of saccades toward the target as a function of latency, at angles 0° and 70°. (A) Probability of saccades toward the target for SNR 0.1. (B) Probability of saccades toward the target for SNR 1. Data are pooled across observers (weighted means with errors). “Fast” and “slow” saccades are determined, subject by subject, based on whether they were below or above the individual median latency, respectively. Green circles: angle 0°; red circles: angle 70°. The dashed line indicates the guessing level (0.5 probability).

