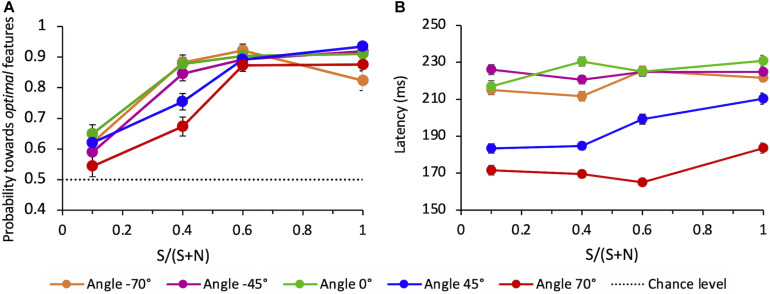
FIGURE 9.
(A) Average probability of correct saccades as a function of SNR at different angles. Data are pooled across observers (weighted means with their errors). The dashed line indicates the guessing level for this task (0.5 probability). (B) Average latency of correct saccades as a function of SNR at different angles. Averages are taken over all correct trials (classified as “to-the-target”) and all observers (weighted means with their errors).

