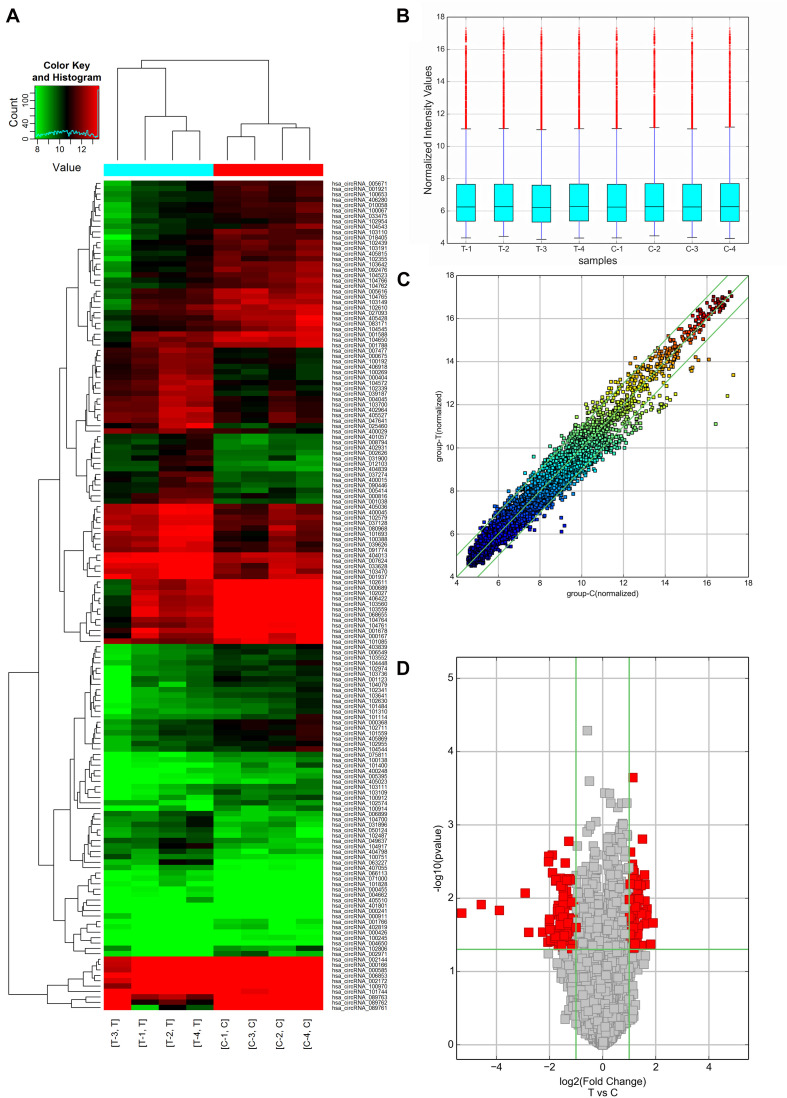
FIGURE 2.
circRNA expression profiles of AMI patients (Group T: T1, T2, T3, T4, and n = 4) and mild coronary artery stenosis patients (Group C: C1, C2, C3, C4, and n = 4) screened by microarray analysis. (A) Heat Map showing a distinguishable expression profile of circRNAs between two groups. Black stands for 0, indicating no change in gene expression; red represents up-regulation, and green represents down-regulation. (B) Boxplot view showed the distribution of normalized expression intensity values for two groups. (C) Scatter plot indicated the variation of circRNA expression in AMI patients (y-axis) and mild coronary artery stenosis patients (x-axis). (D) Volcano plots visualizing differential circRNA expression between the two groups. The vertical lines correspond to a 2.0-fold change (FC) (log2 scaled) (up-regulation and down-regulation, respectively).

