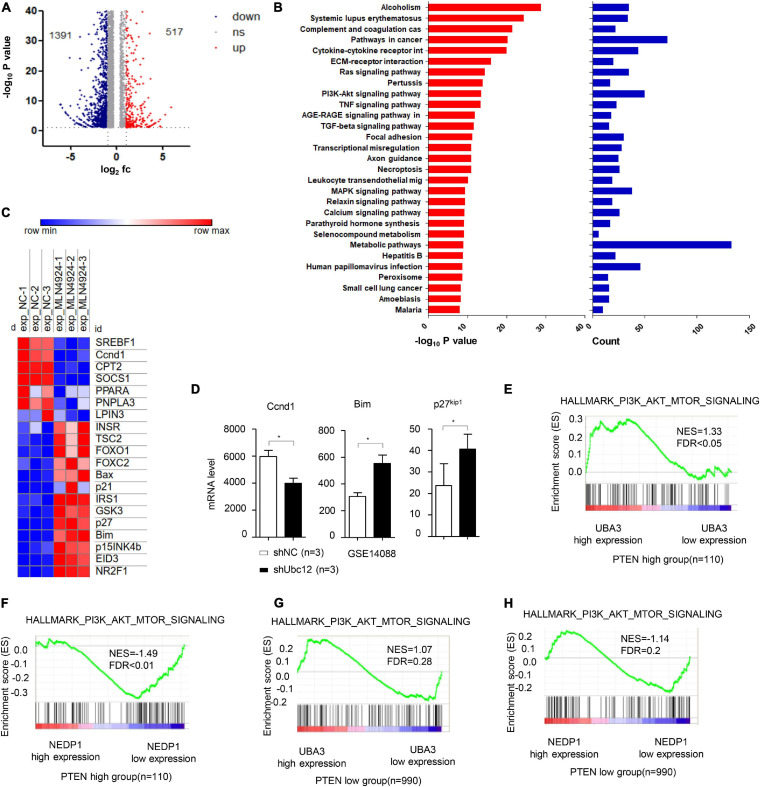
FIGURE 1.
MLN4924 inhibits the PI3K/Akt signaling pathway. (A) Differentially expressed genes in MCF-7 cells between DMSO and MLN4924 (5 μM; 24 h) treatment groups are plotted as a volcano plot. (B) Bar charts depict the top ranked pathway analyzed from the KEGG pathway database. Blue (upper) and red (bottom) bars represent counts and significance (–log10 P-value), respectively. (C) Heat map of the downstream target genes of Akt signaling pathway between the DMSO and MLN4924 treatment group. (D) The mRNA level of Ccnd1, Bim and p27 were analyzed in Ubc12 knockdown NIH 3T3 cells. The GEO2R online tool was used to analyze differentially expressed genes on GSE14088 microarray. *P < 0.05, **P < 0.01, ***P < 0.001. (E,F) Enrichment plots of gene expression signatures for PI3K/Akt signaling according to UBA3 mRNA levels by gene set enrichment analysis (GSEA) of TCGA BRCA dataset in PTEN high expression group (NES = 1.33, FDR < 0.05) and PTEN low (with almost undetectable PTEN level) expression group (NES = 1.07, FDR = 0.28), respectively. Samples were divided into high and low UBA3 expression groups. False discovery rate (FDR) gives the estimated probability that a gene set with a given normalized ES (NES) represents a false-positive finding; FDR < 0.05 is a widely accepted cutoff for the identification of biologically significant gene sets. (G,H) Enrichment plots of gene expression signatures for PI3K/Akt signaling according to NEDP1 mRNA levels by gene set enrichment analysis (GSEA) of TCGA BRCA dataset in PTEN high expression group (NES = –1.49, FDR < 0.01) and PTEN low (with almost undetectable PTEN level) expression group (NES = –1.14, FDR = 0.2), respectively.

