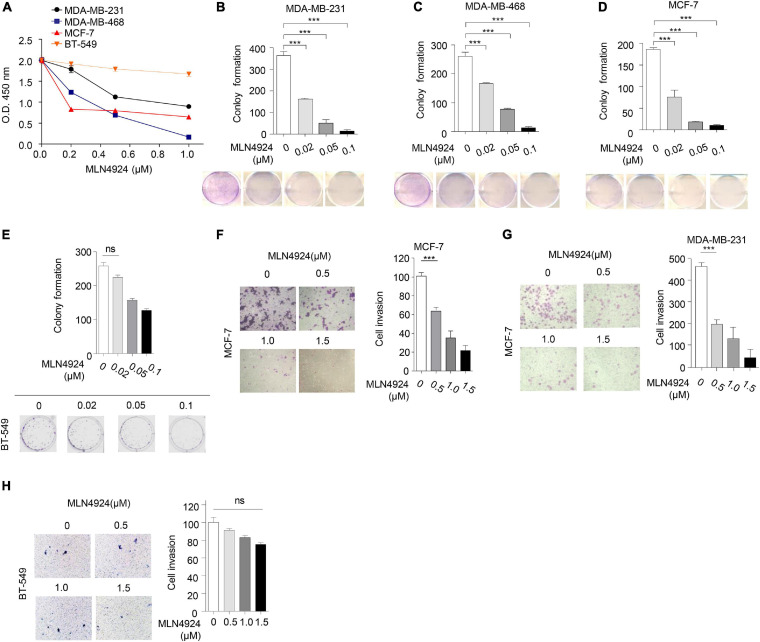
FIGURE 3.
Anti-tumor effect of MLN4924 is dependent on PTEN. (A) Cells were treated with serial dilutions of MLN4924 for 72 h and cell viability was determined using CCK8 assays. Representative inhibitory curves from three independent experiments are shown for each cell line. (B–E) Cells were seeded into 6-well plates petri-dishes at 500 cells per dish in triplicate and treated with MLN4924 for 12 days, followed by 0.01% (w/v) crystal violet staining and colony counting. Representative images of three independent experiments are shown for colony formation. Image J was used to perform quantitative analysis. (F–H) Cells were treated with indicated concentrations of MLN4924 for 12 h before being subjected to trans-well migration analysis. Shown are representative images. Image J was used to perform quantitative analysis. Shown are representative images. Image J was used to perform quantitative analysis. Data are shown as the mean ± SD. P-values were calculated by one-way ANOVA test (B–H) and two-way ANOVA test (A). *P < 0.05, **P < 0.01, ***P < 0.001.

