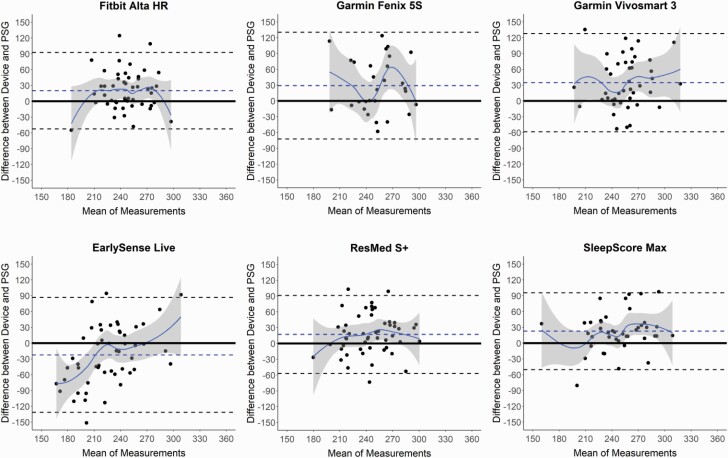
Figure 5.
Bland–Altman plots: light sleep. Bland–Altman plots depicting the minutes of light sleep for the devices compared with polysomnography (PSG). For PSG, light sleep was calculated as the combination of N1 and N2 sleep stages. Only devices that output data on sleep stages are depicted. See Figure 1 caption for additional details on the interpretation of Bland–Altman plots.

