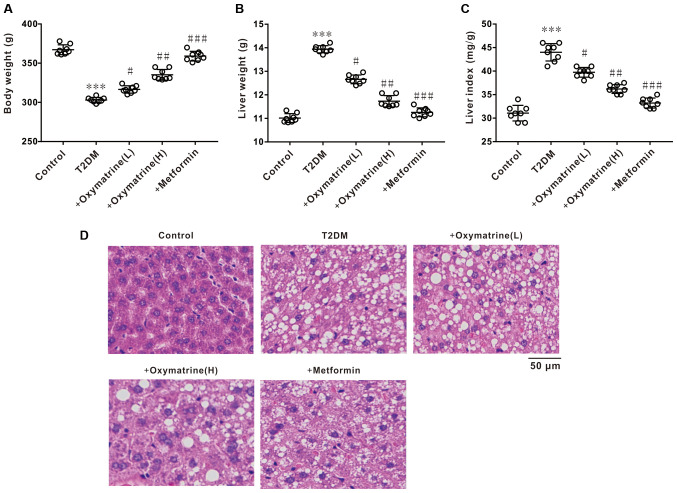
Figure 5.
Effects of oxymatrine on liver index and liver tissue morphology of the T2DM rats. (A) Body weight, (B) liver weight and (C) liver index of the treated rats. (D) Representative images of HE staining of the liver. Differences between groups were compared using a one-way ANOVA. All experiments were repeated 3 times and all data are presented as the mean ± standard deviation. ***P<0.001 vs. control; #P<0.05, ##P<0.01, ###P<0.001 vs. T2DM. T2DM. T2DM, type 2 diabetes mellitus; +oxymatrine (L), type 2 diabetic rats treated with 10 mg/kg body weight oxymatrine; +oxymatrine (H) type 2 diabetic rats treated 20 mg/kg body weight oxymatrine; +Metformin, type 2 diabetic rats treated with 250 mg/kg body weight metformin; HE, hematoxylin and eosin.

