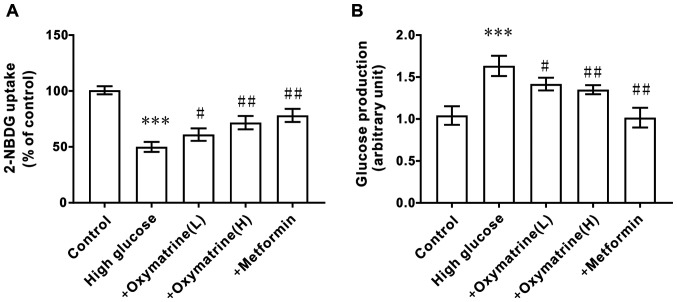
Figure 6.
Effect of oxymatrine on glucose production and uptake in HepG2 cells. (A) glucose production assay, and (B) 2-NBDG uptake assay in the treated cells. Differences between groups were compared using a one-way ANOVA. All experiments were repeated 3 times and all data are presented as the mean ± standard deviation. ***P<0.001 vs. control; #P<0.05, ##P<0.01 vs. High Glucose. +oxymatrine (L) cells treated with 0.1 µM oxymatrine; +oxymatrine (H) cells treated with 1 µM oxymatrine; +Metformin, cells treated with 0.1 µM metformin.

