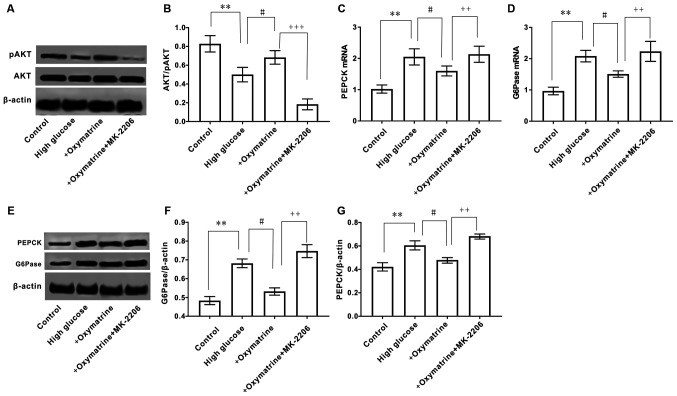
Figure 8.
Effect of inhibition of AKT on the expression of AKT, PEPCK and G6Pase in HepG2 cells. (A) Protein expression of AKT and pAKT. (B) Ratio of pAKT to AKT. mRNA expression levels of (C) PEPCK and (D) G6Pase. (E) Protein expression of PEPCK and G6Pase. Ratio of (F) G6Pase to β-actin and (G) PEPCK to β-actin. Differences between groups were compared using a one-way ANOVA. All experiments were repeated 3 times and all data are presented as the mean ± standard deviation. **P<0.01 vs. control; #P<0.05 vs. High Glucose; ++P<0.01, +++P<0.001 vs. +oxymatrine. PEPCK, phosphoenolpyruvate carboxykinase; G6Pase, glucose-6-phosphatase.

