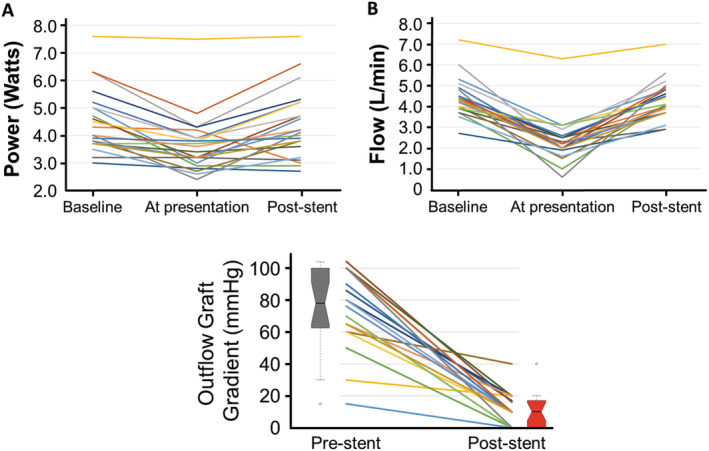
Figure 1.

Changes in left ventricular assist device (A) power and (B) estimated flow at baseline, on presentation with outflow graft obstruction, and after percutaneous intervention. (C) Change in left ventricular assist device outflow graft pressure gradient pre‐stent and post‐stent placement. Boxes demonstrate median and interquartile range; notches represent the 95% confidence interval around the median; whiskers identify pressures up to 1.5× interquartile range; and circles represent extreme outliers.
