Figure 2.

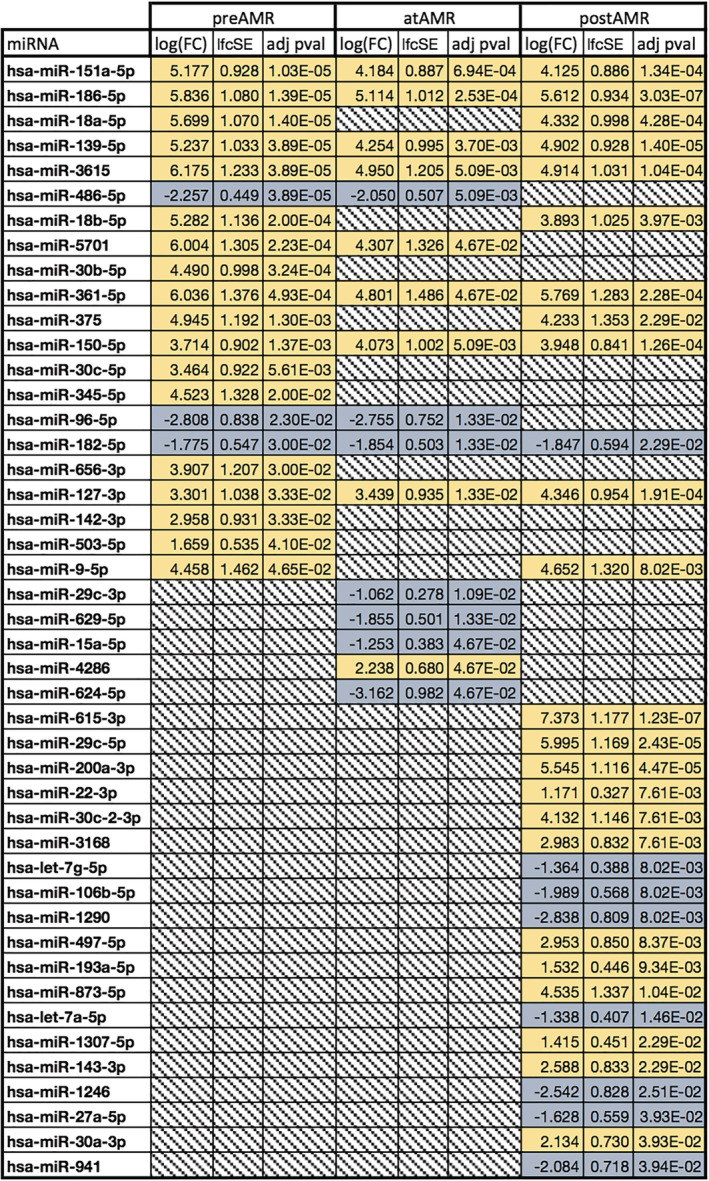
Significant miRNA abundance changes before, during, and after antibody‐mediated rejection (AMR). Down‐regulated in blue, up‐regulated in yellow, and greyed out where non‐significant (P ≥ 0.05).

Significant miRNA abundance changes before, during, and after antibody‐mediated rejection (AMR). Down‐regulated in blue, up‐regulated in yellow, and greyed out where non‐significant (P ≥ 0.05).