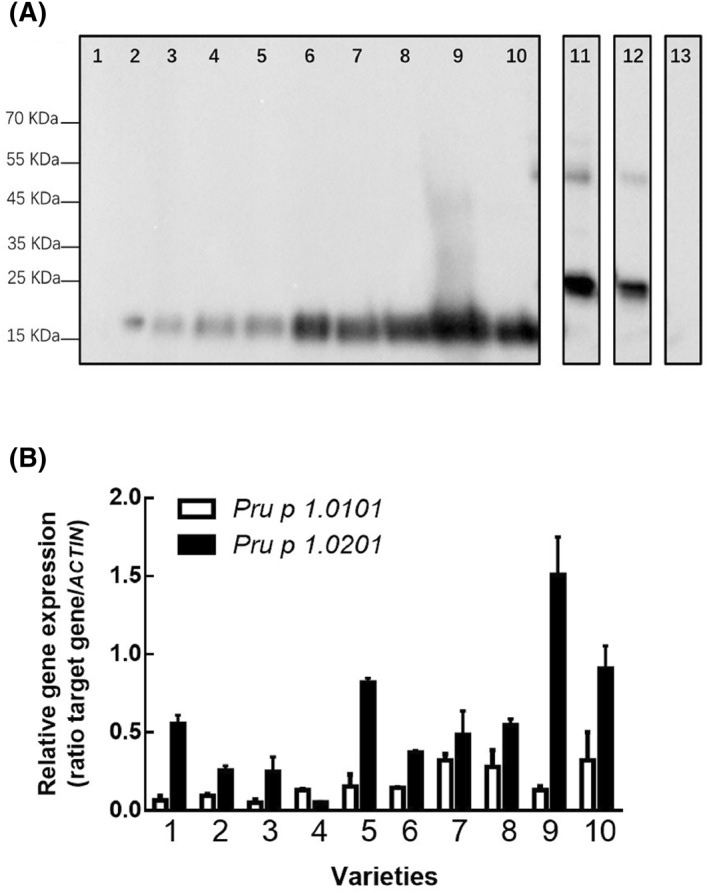
FIGURE 5.

Immunoblot and quantitative polymerase chain reaction (qPCR) of 10 representative low/medium/high Pru p 1varieties. (A) (1) “Mao Tao 1”; 2–4: low Pru p 1 group. (2) “Zi Xue Tao”; (3) “Wu Yue Xian”; (4) “Nan Shan Tian Tao”; 5–7: medium Pru p 1 group. (5) “Xue Bu Dai”; 6), “Chi Yue”; (7) “Yuan Meng”; 8–10: high Pru p 1 group. (8) “Zao Zhen Bao”; (9) “Chun Lei”; (10), “Zhong You 7”; (11) rPru p 1.01 (0.25 μg); (12) rPru p 1.02 (0.1 μg); (13), BSA (0.1 μg). (B) qPCR results of Pru p 1.0101 and Pru p 1.0201 in 10 selected varieties
