
Figure 2. Center-Involved Diabetic Macular Edema.
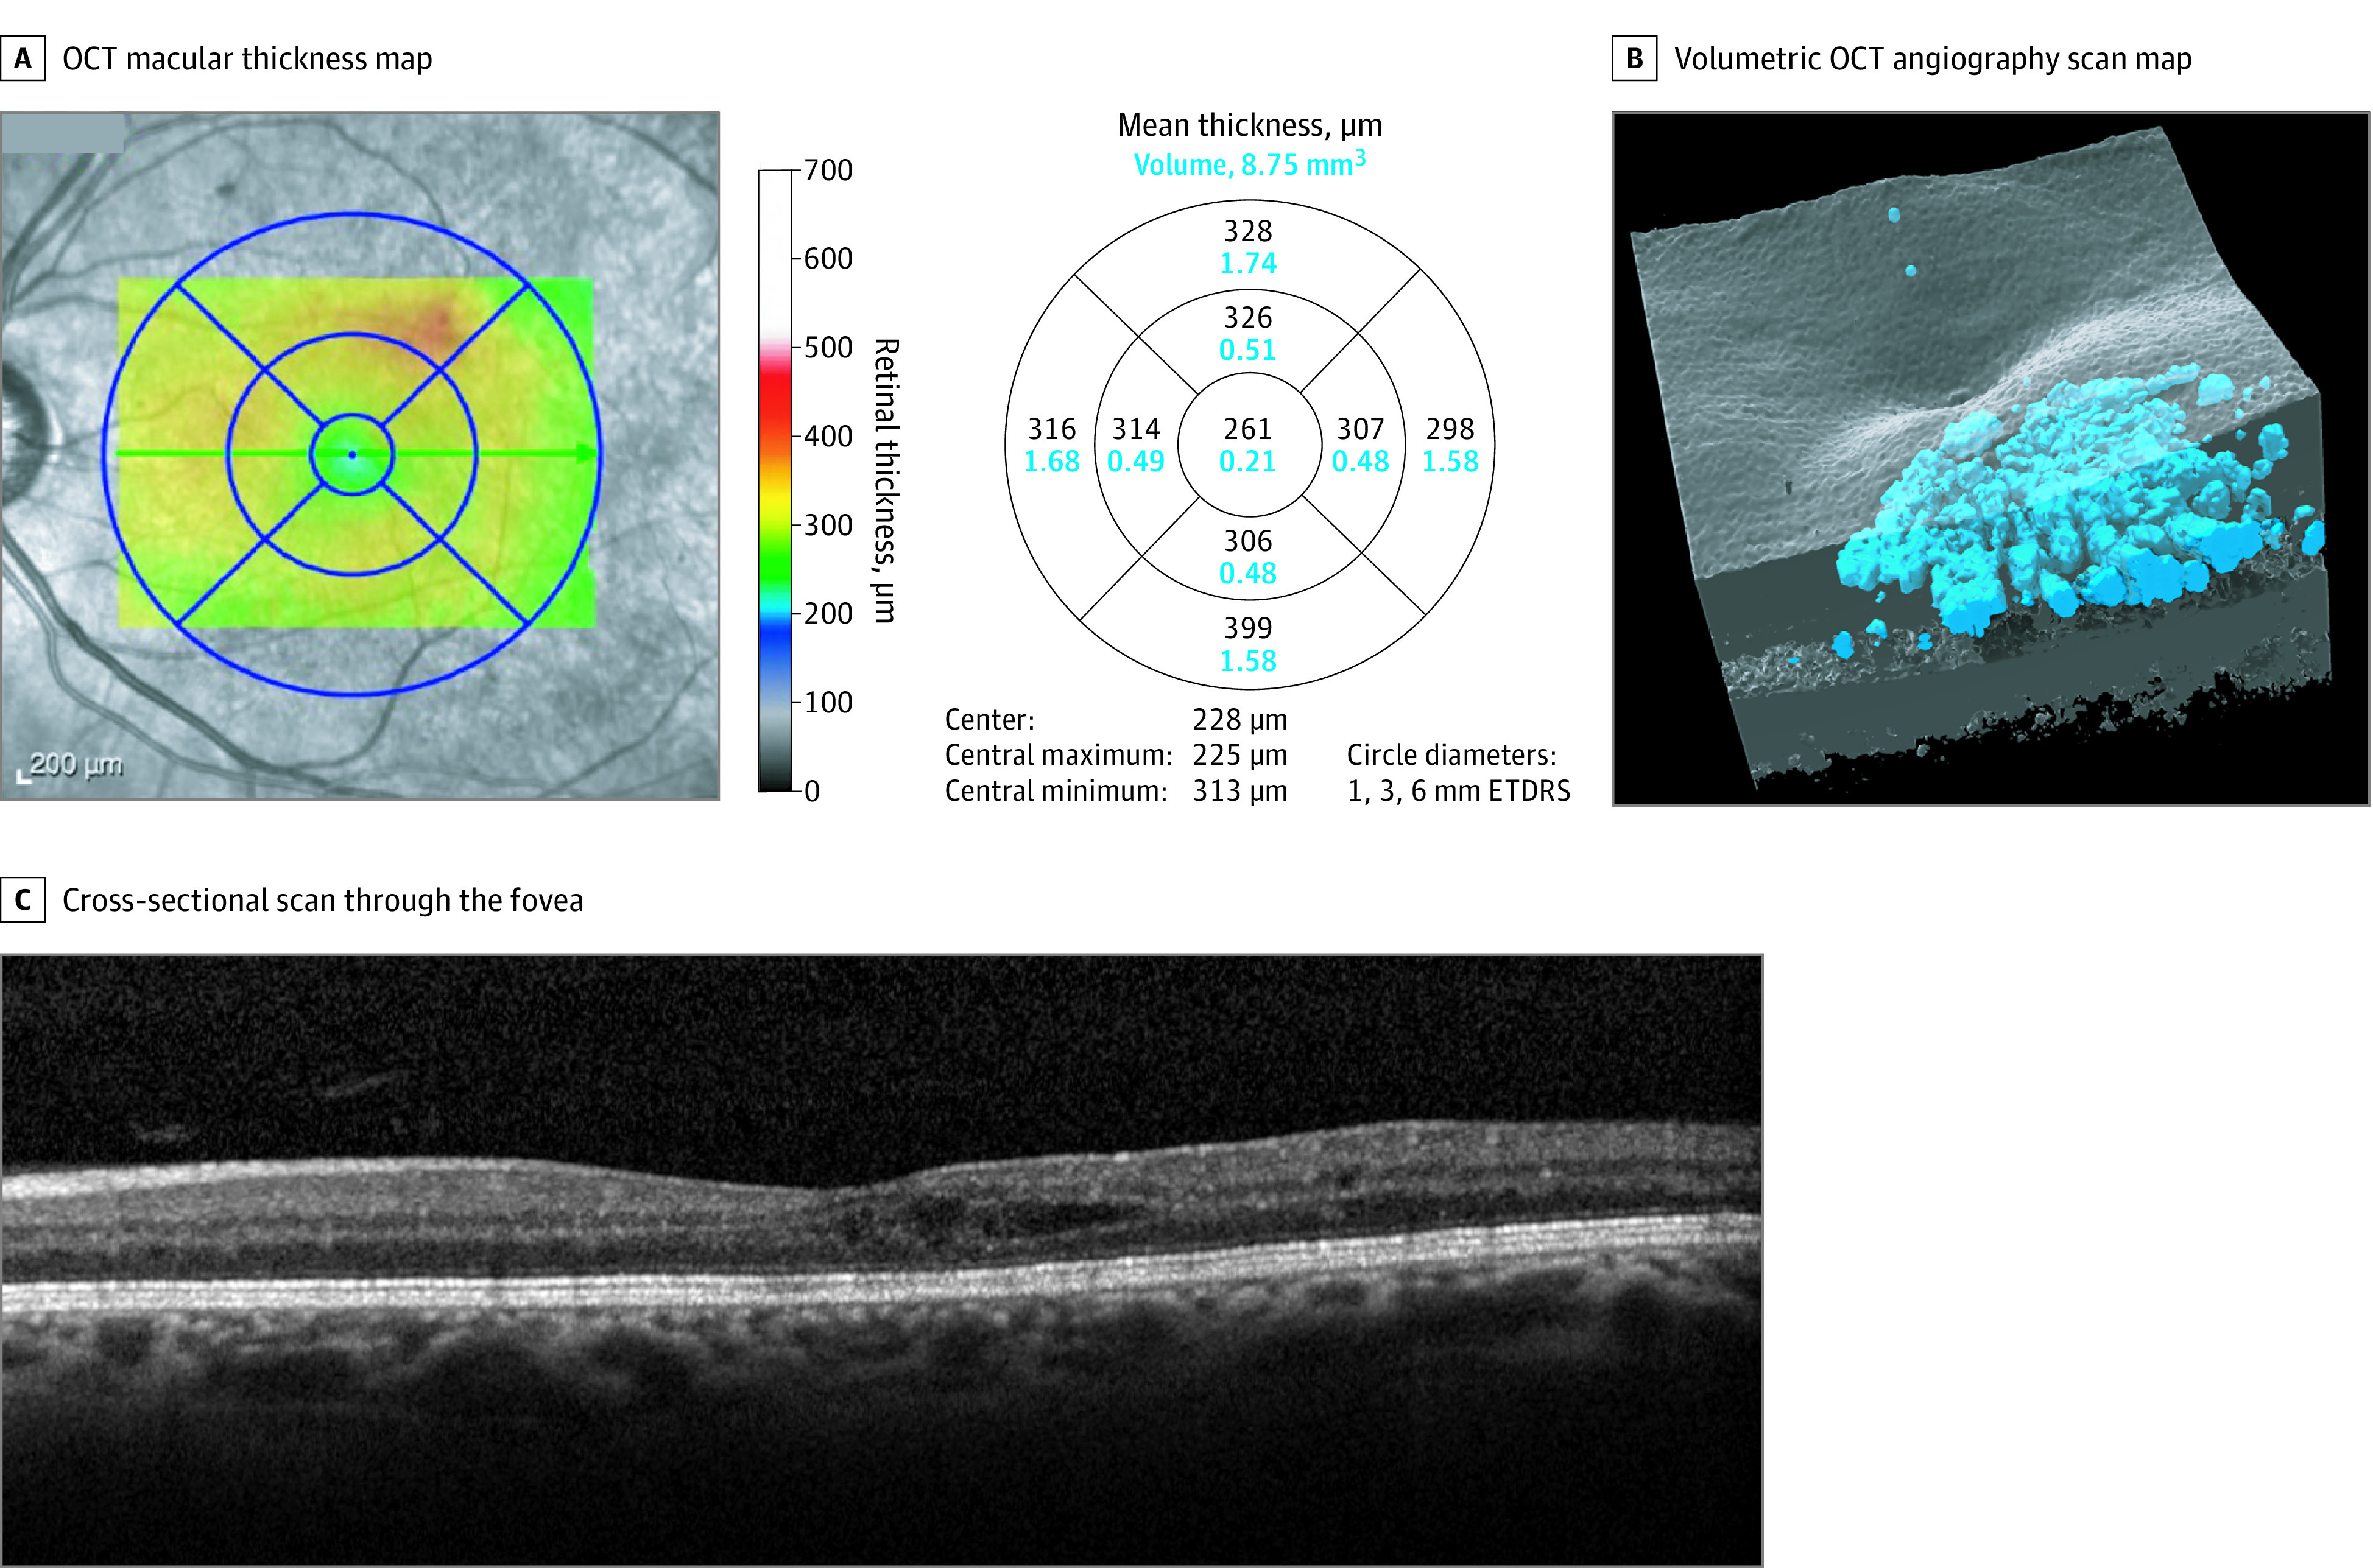
A, Optical coherence tomography (OCT) macular thickness map. B, 3-Dimensional rendering of the volumetric OCT angiography scan volume. The blue indicates automatically detected fluid. C, Cross-sectional scan through the fovea. The central macular fluid volume (0.043768 mm3) from the OCT angiography scan determined the diagnosis of diabetic macular edema but central subfield thickness (261 μm) did not. ETDRS indicates Early Treatment Diabetic Retinopathy Study.