Figure 5.
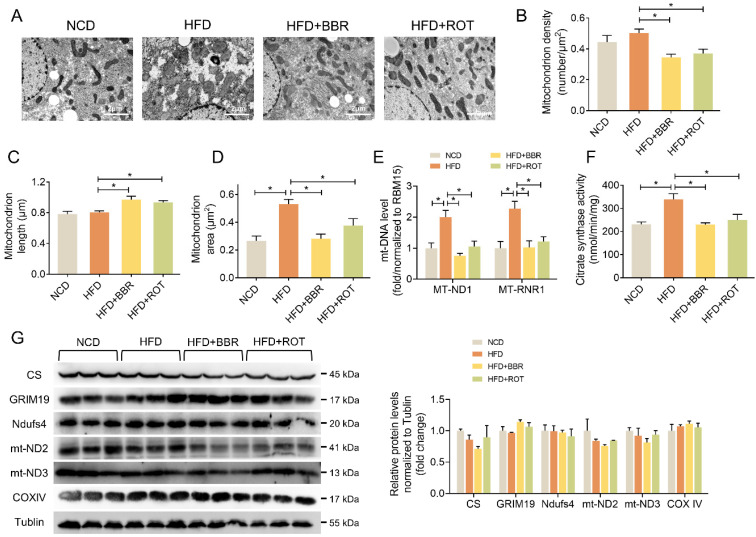
BBR and ROT promoted liver mitochondrial fusion. (A) Morphology and structure of mitochondria in liver with TEM. (B-D) The mitochondrial density (B), length (C) and area (D) by the statistical analyze of TEM (n =10). (E) Hepatic mtDNA copies (n = 7). (F) Citrate synthase activity of liver mitochondria (n = 6). (G) The protein levels of electron transport chain genes (CS, GRIM19, Ndufs4, mt-ND2, mt-ND3 and COXIV) by Western blot and relative signal strength quantification (n =3). Data were expressed as means ± SEM. *P < 0.05.

