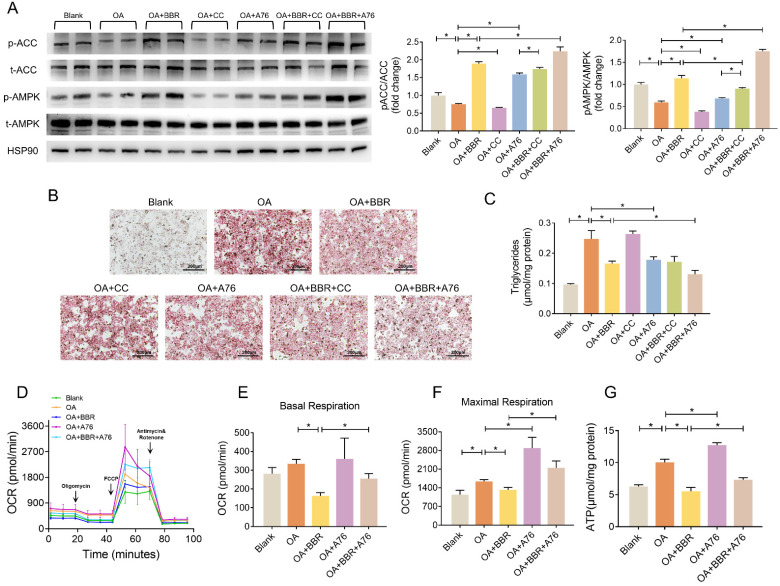
Figure 6.
BBR activated AMPK pathway. (A) Phosphorylation of AMPK and ACC in the primary hepatocytes after blank, OA, OA+BBR, OA+CC, OA+A76, OA+BBR+CC or OA+BBR+A76 treatment by Western blot and relative signal strength quantification (n = 3). (B-C) Intracellular triglyceride content (B) and oil red staining (C) of the hepatocytes incubated with different treatment (n = 5). (D) OCR determined by Seahorse XFe-24 in primary hepatocytes responding to oligomycin, FCCP, antimycin, and rotenone (n = 3). (E-F) OCR of basal and maximal respiration calculated from the real-time oxygen consumption curve presented in (D). (G) ATP content of primary hepatocytes treated with blank, OA, OA+BBR, OA+A76 and OA+BBR+A76 (n = 8). Data were expressed as means ± SEM. *P < 0.05.

