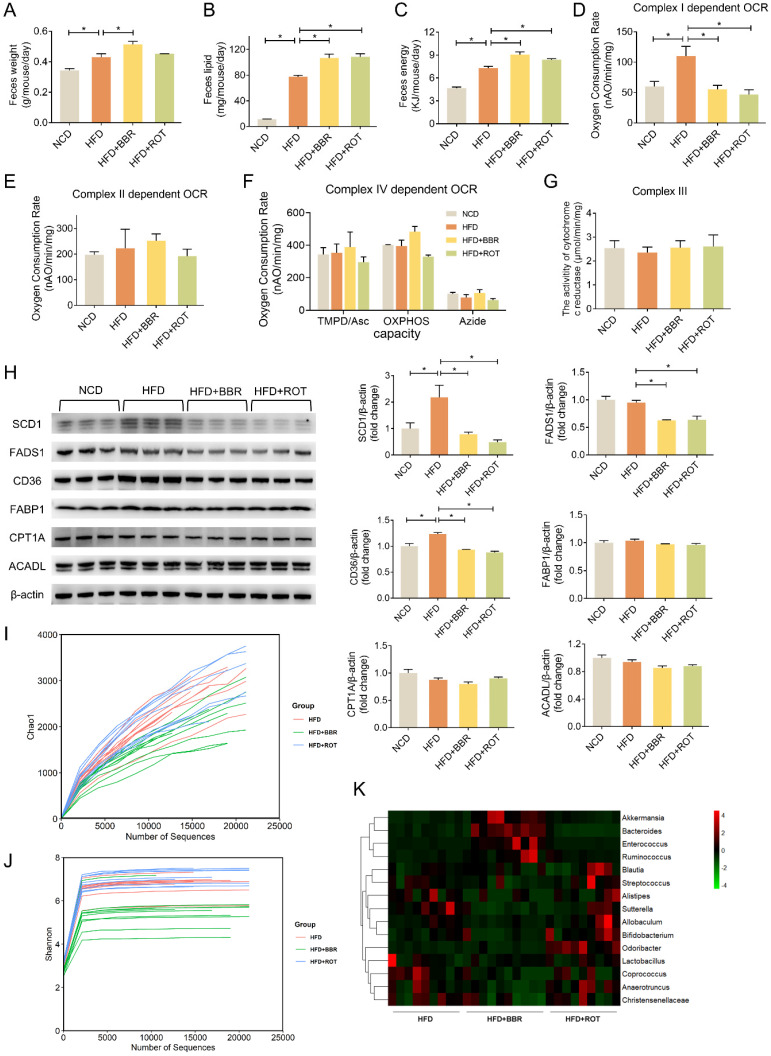
Figure 7.
BBR promoted lipid excretion by inhibiting intestinal complex I. (A-C) Daily fecal amount (A), lipid excretion (B) and fecal energy (C) of each group in seven consecutive days (n = 3). (D-F) The gut mitochondria were extracted, and complex I dependent OCR (D), complex II dependent OCR (E) and complex IV dependent OCR (F) were measured (n = 3). (G) The activity of cytochrome c reductase (complex III) of intestine tissues of NFD, HFD, HFD+BBR and HFD+ROT fed mice. (H) The protein levels of representative key-enzymes in lipid pathways of intestinal tissues, such as SCD1 and FADS1 for lipogenesis, FABP1 and CD36 for fatty acid uptake, as well as CPT1A and ACADL for fatty acid oxidation. Relative signal strength was quantified for each band (n = 3). (I-K) Chao1 index (I), Shannon index of microbiota (J) and heat map (K) of sequencing 16S V5-V6 variable region of microbiota in each group (n = 9-10). Data were expressed as means ± SEM. *P < 0.05.

