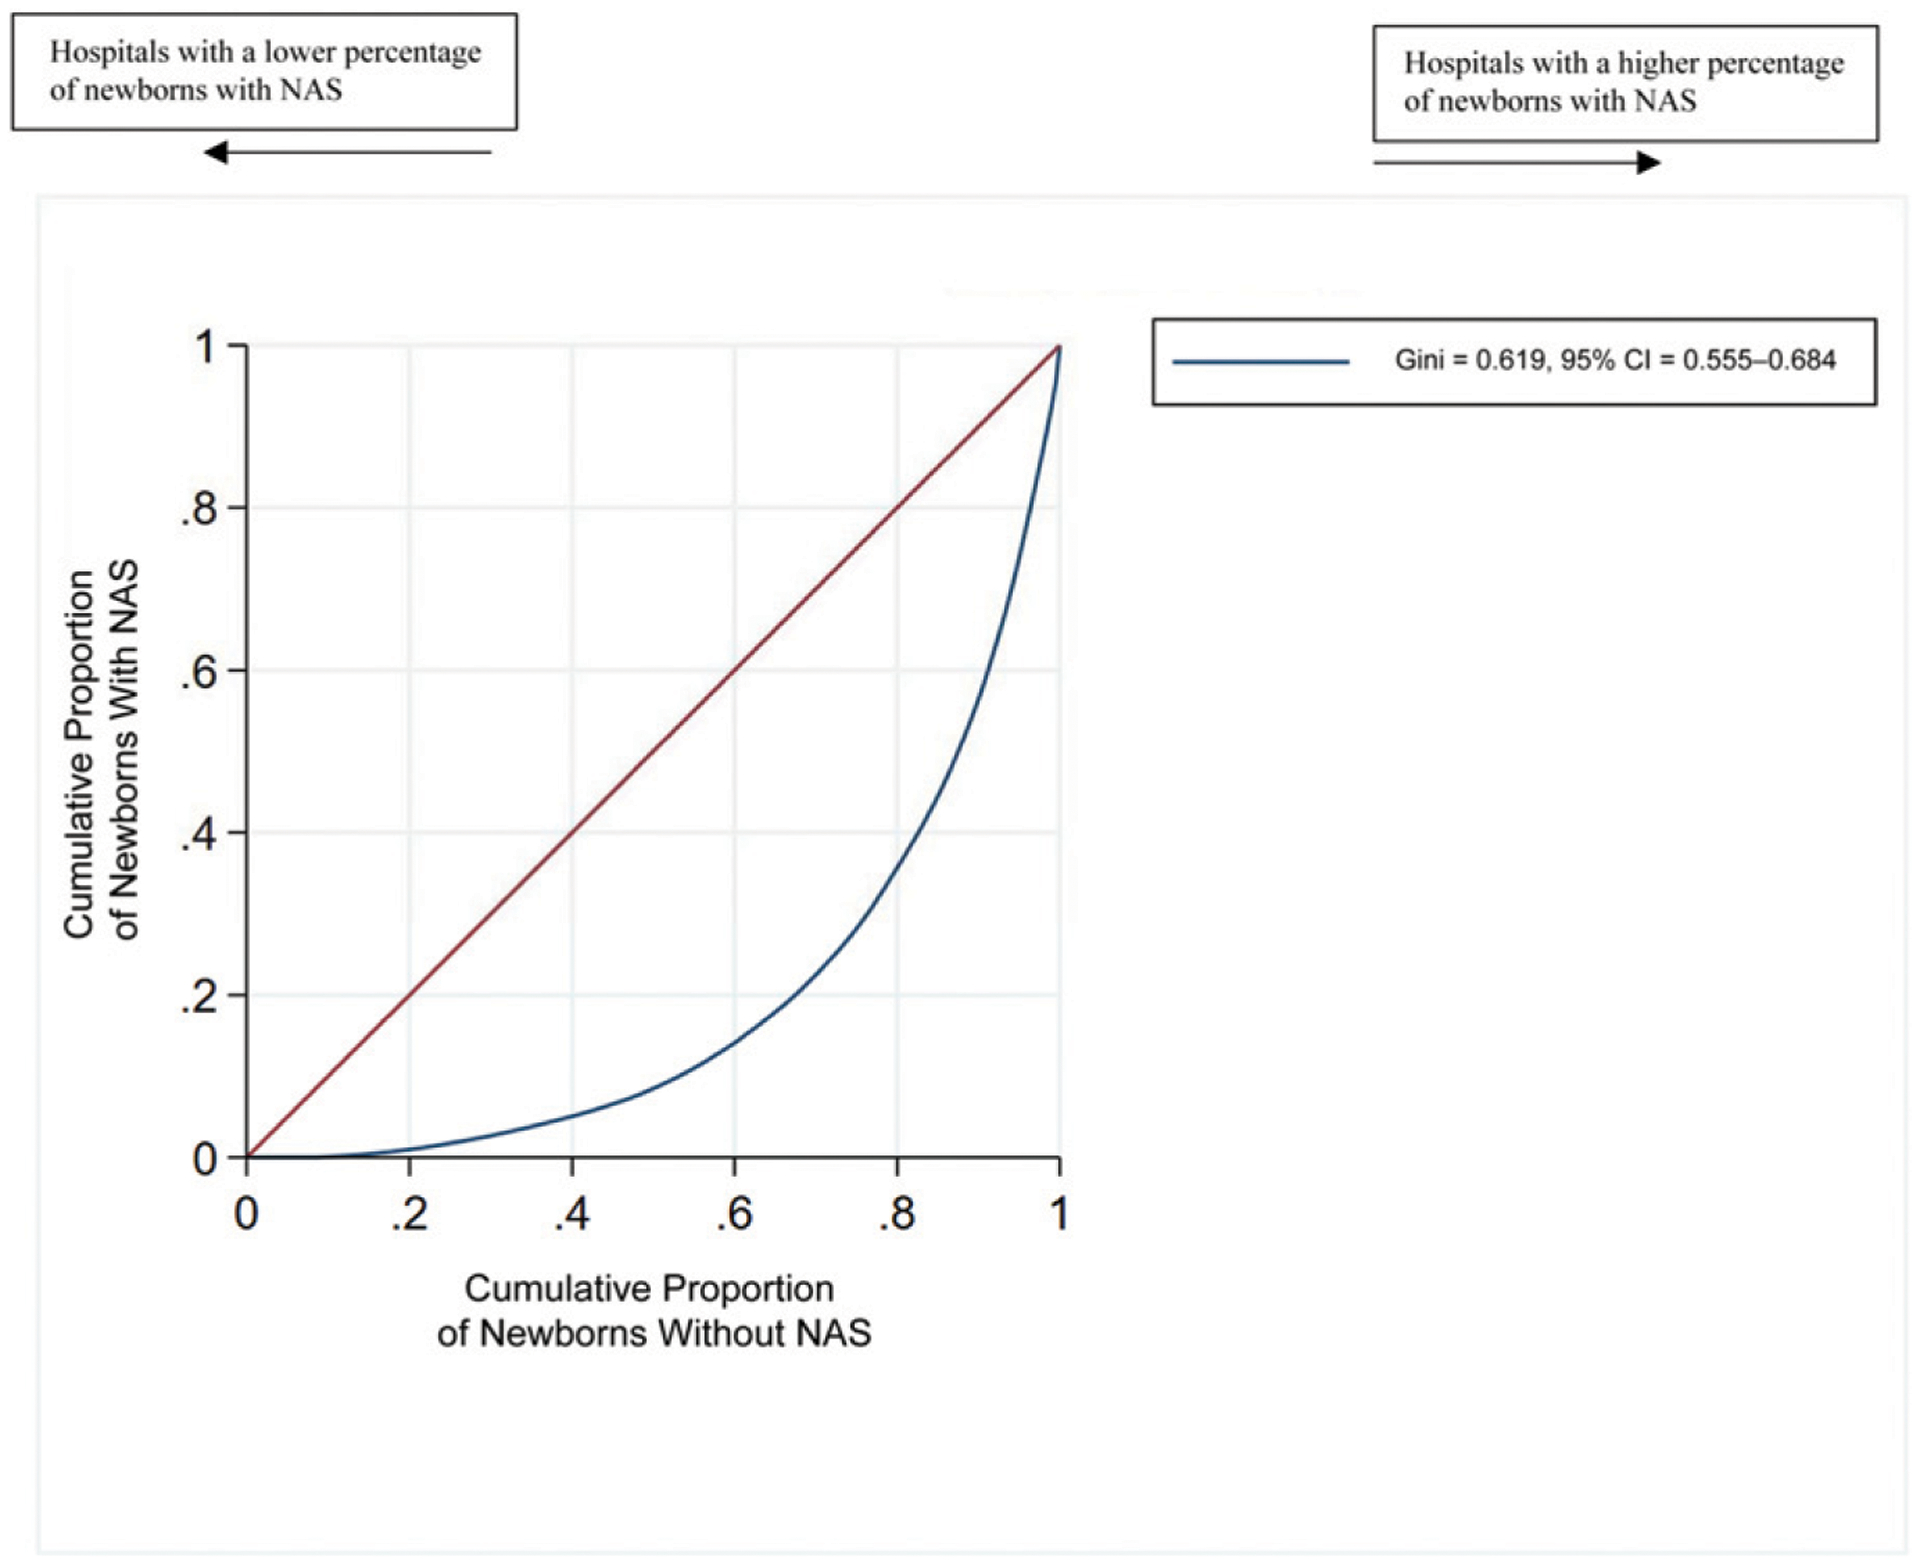
FIGURE 1.

Concentration Lorenz curve for newborns with and without NAS (sample of 659 ÷≠× newborns in 266 hospitals). The curve below the diagonal indicates that newborns with NAS are concentrated in some hospitals as compared with newborns without NAS.
