
Figure 1.
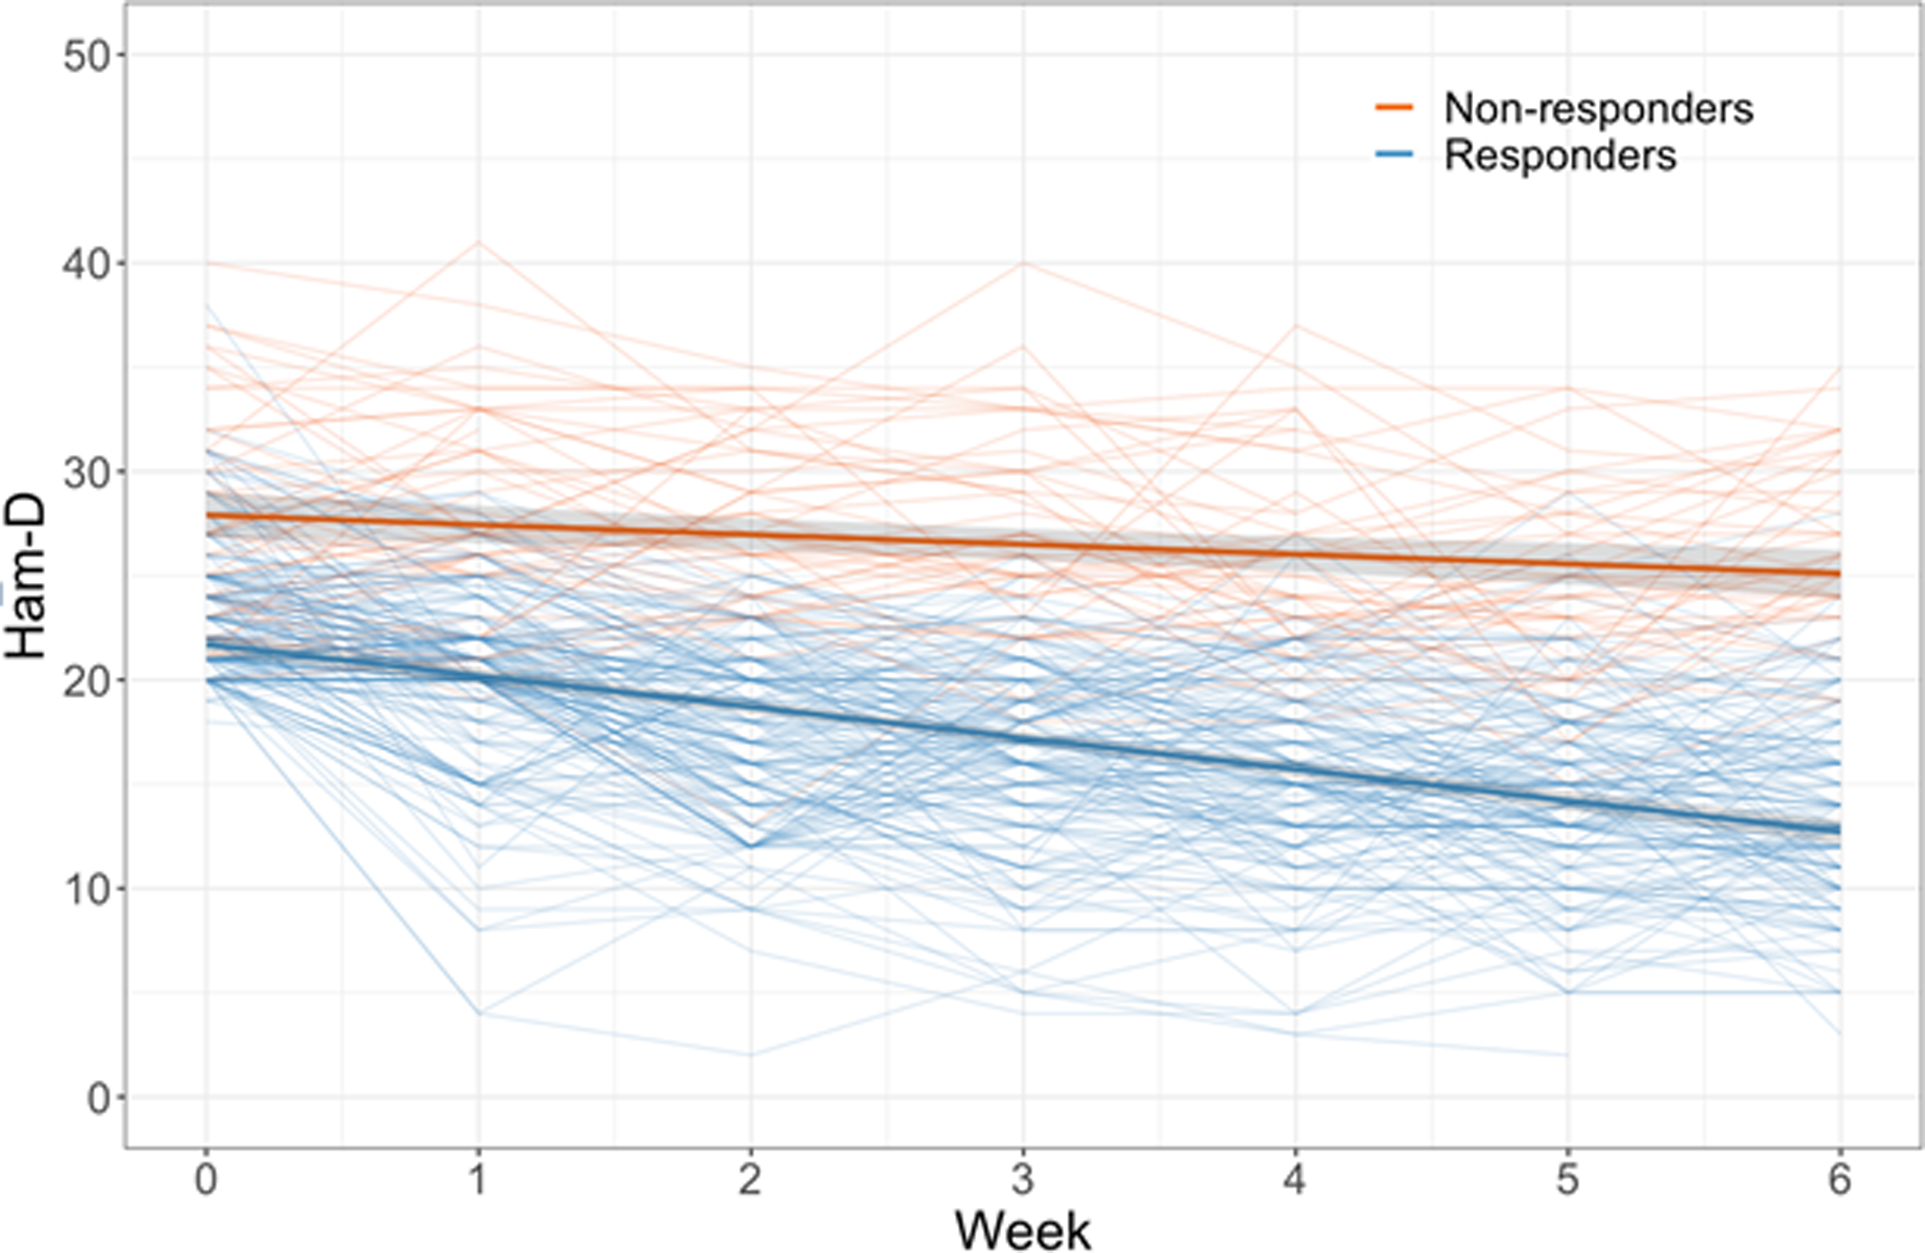
Latent Growth Mixture Model (LGMM) of estimated growth curves of depression severity from baseline to Week 6
Note. HAMD = 24-item Hamilton Depression Rating Scale. The Figure presents two LGMM trajectories of change over 6 weeks in 12-weeks of treatment, with 95% Confidence Intervals. Orange color represents early non-responders (22.5%). Blue color represents early responders (77.5%).