
Figure 2.
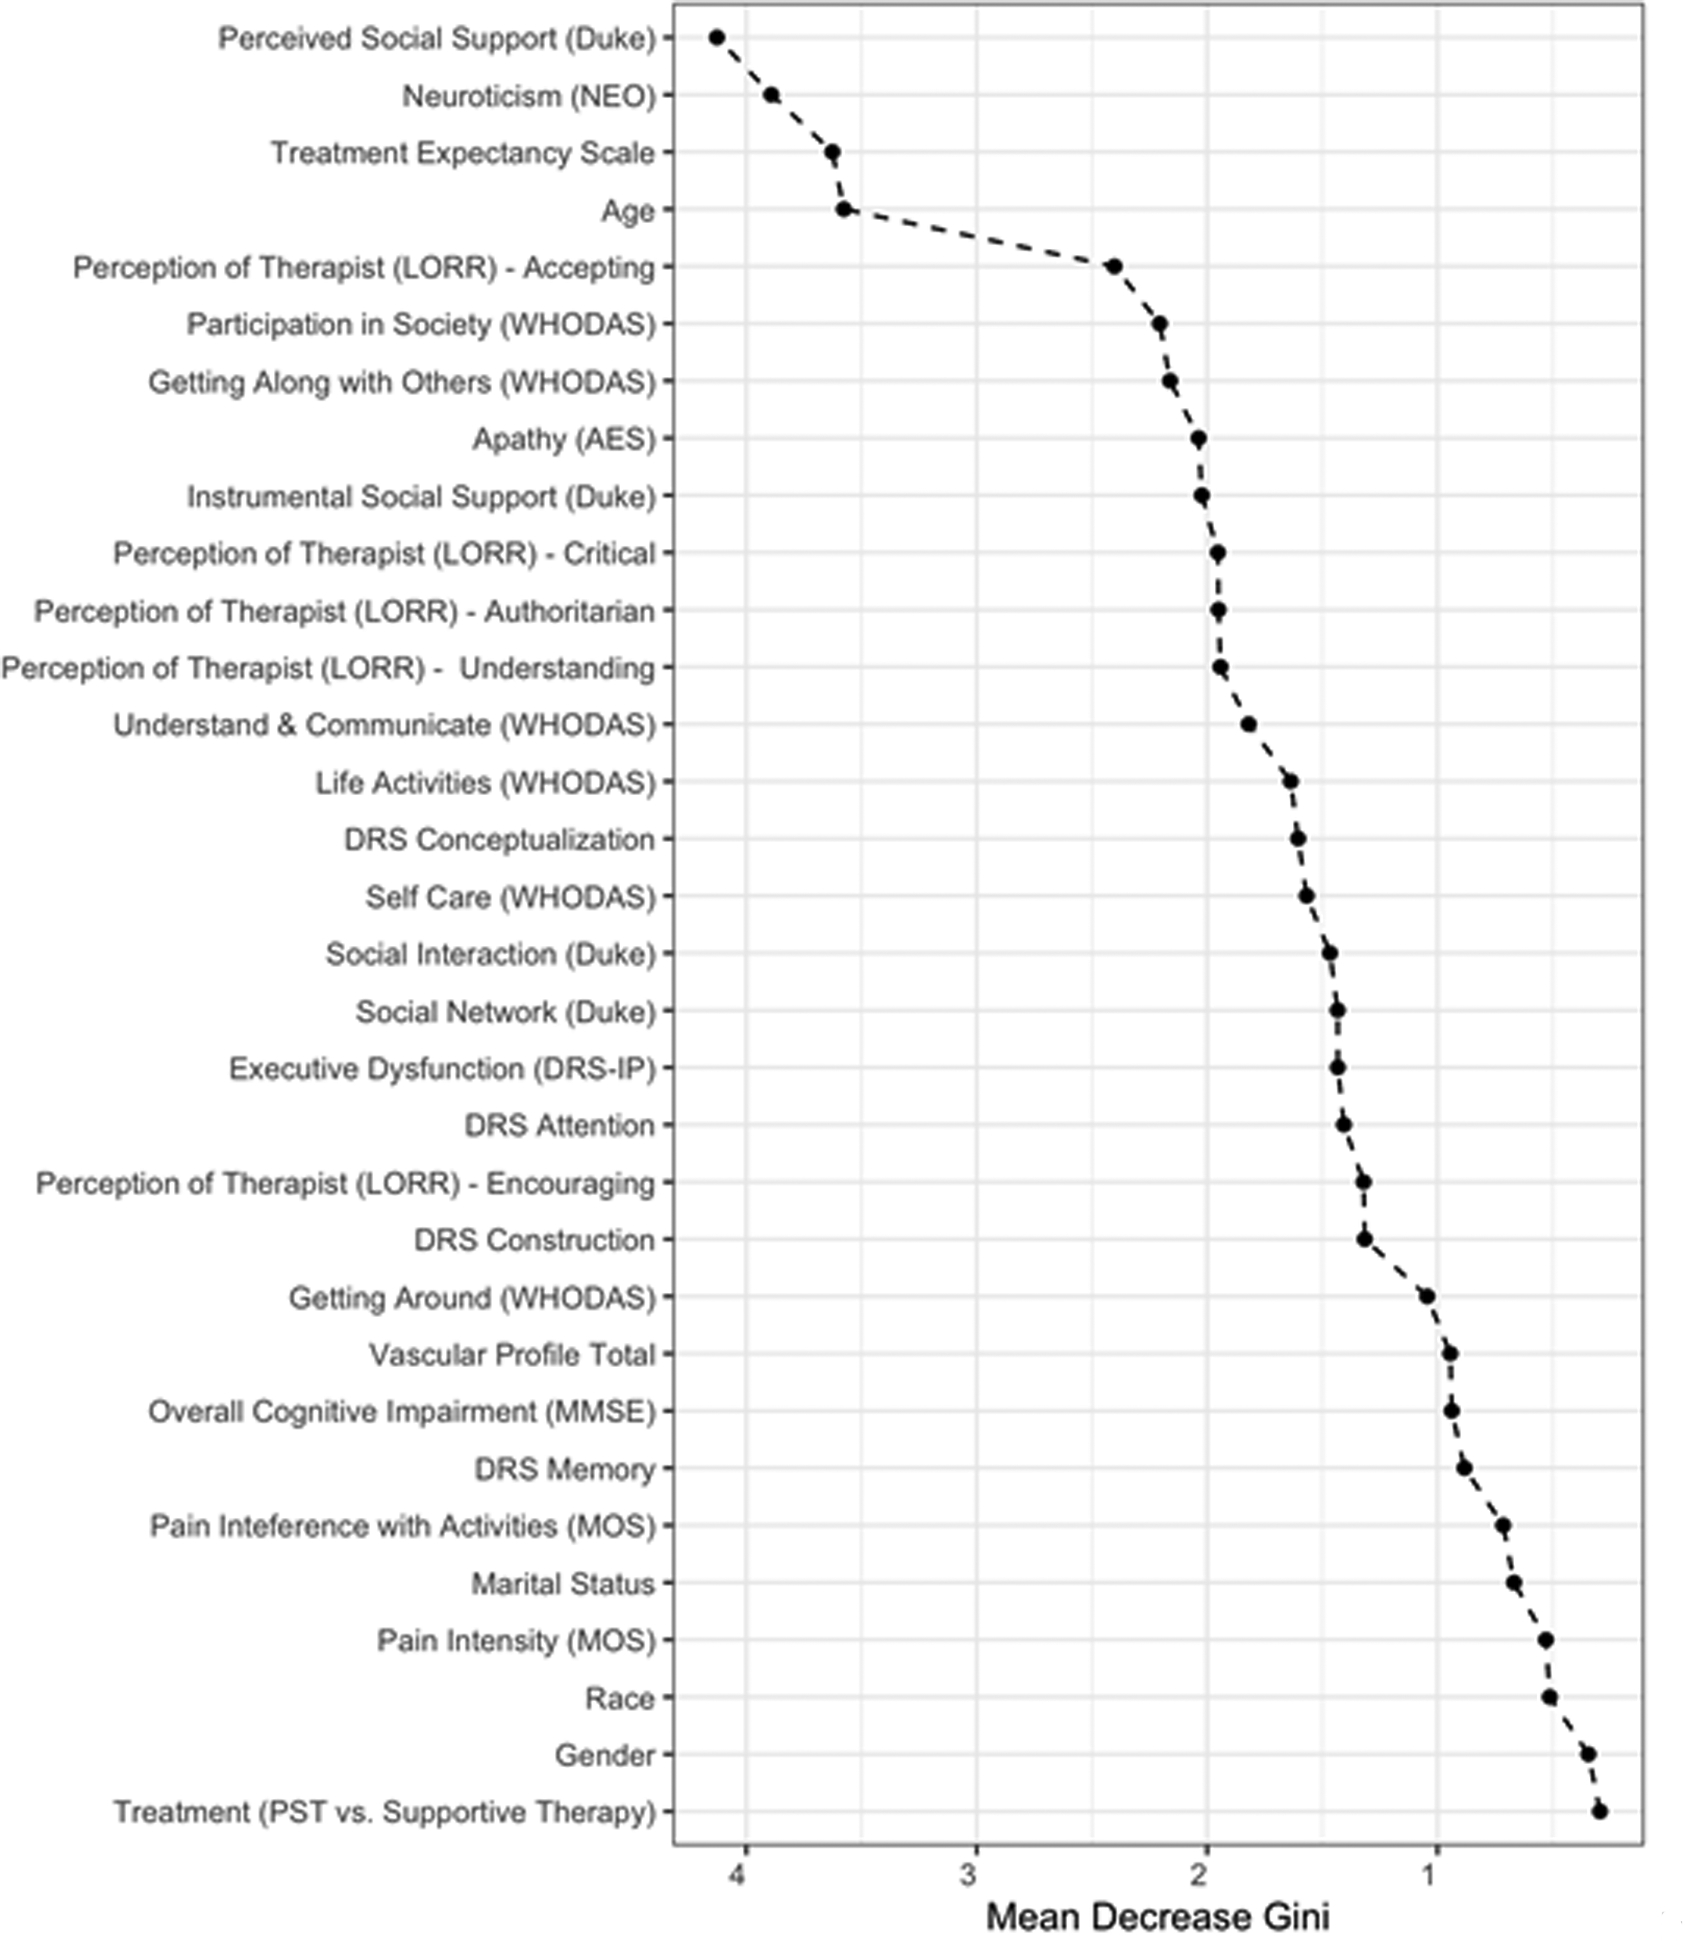
Variable importance in predicting membership in growth curves of depression severity (from baseline to week 6) estimated by random forests
Note. Predictors are presented from top to bottom in order of importance. The horizontal axis represents mean decrease in Gini Impurity Index (a weighted average of reduction in leaf node impurities