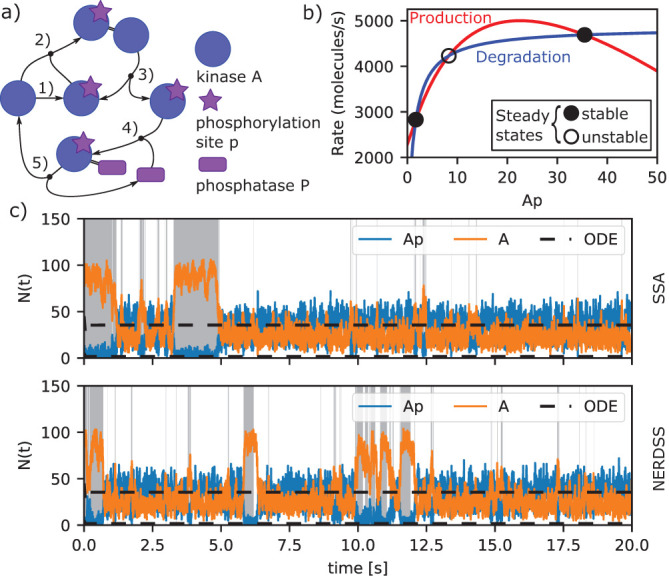
FIGURE 6:

Positive feedback induces stochastic switching in a kinase autophosphorylation circuit. (a) Model reactions. The kinase A (blue circle) becomes active on phosphorylation (purple start; reaction 1) and serves as its own substrate (reactions 2 and 3). A phosphatase P (purple rectangle) binds and dephosphorylates the phosphorylated kinase (reactions 4 and 5). The activation reactions 2 and 3 form a positive feedback for kinase activation. A low rate of spontaneous activation of the kinase (reaction 1) is also included to prevent the system from being trapped in a state with no active kinase. (b) Rate balance plot identifying steady state concentrations of phosphorylated kinase (Ap). The red and blue lines show the rates of production (sum of rates of reactions 1 and 3) and degradation (rate of reaction 4) of Ap for the parameter values and initial concentration simulated here (Materials and Methods). Intersections of these curves indicate points at which production and degradation rates are equal and hence give rise to a steady state of the system. The two intersection points shown with filled circles indicate the stable steady states of the system, which occur at Ap concentrations of 1.7 and 35.5 molecules, respectively. A third steady state (open circle) indicates an unstable steady state, which occurs at a value of 8.3 Ap molecules. (c) Model trajectories computed with deterministic and stochastic methods. Deterministic trajectories starting from different initial conditions may relax to either of the two stable steady states (black dashed lines). Stochastic trajectories exhibit fluctuations about each of the steady states and occasionally switch between states with low and high kinase activation as shown by the blue trajectory. The top panel shows the result of a nonspatial stochastic simulation (SSA) and the bottom panel shows the result of a spatial stochastic simulation using the same paramenters (NERDSS). Regions of the trajectories shaded gray indicate where the system is in the state with low kinase activation with correspondingly high levels of inactive kinase (orange lines). In the regions with no shading the system is in a state with high kinase activation, as indicated by the active kinase level (blue lines) generally being above the inactive kinase level. The spatial stochastic simulations performed with NERDSS exhibit small differences from the nonspatial simulations carried out using SSA when performed in 3D with all species having a diffusion constant of 100 μm2 /s, and the same macroscopic rate is targeted (see Materials and Methods for full details on parameters used in simulation).
