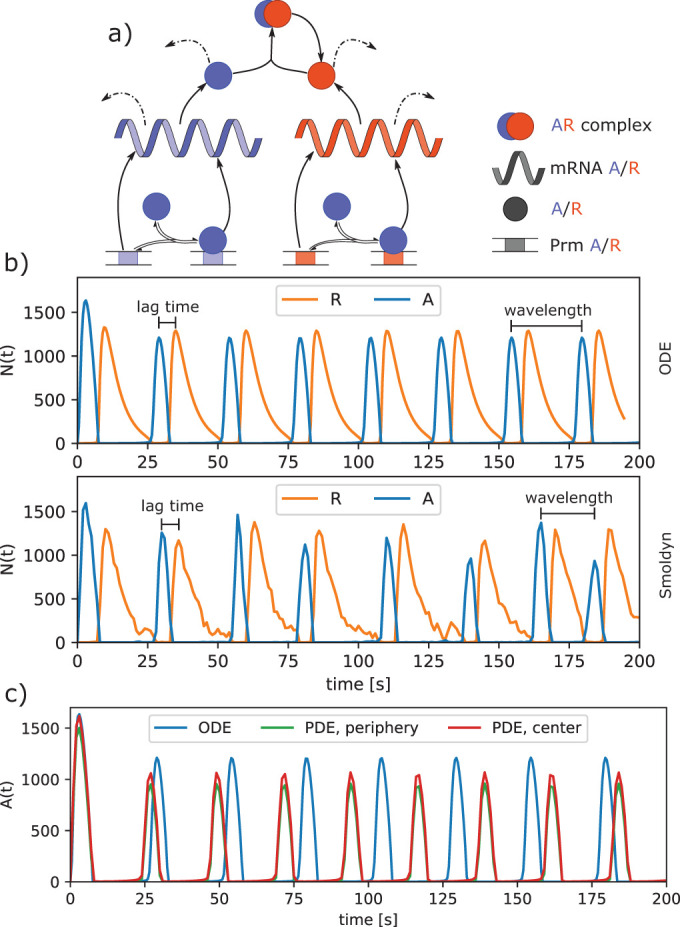
FIGURE 7:

Circadian clock model shows robustness of oscillations to stochastic fluctuations. (a) Model of two proteins, A and R, translated from corresponding mRNA and transcribed from the corresponding genes (Prm A/R). Protein A is an activator that binds to the promoter of both genes and increases their transcription. Protein R acts as a repressor that binds to A and catalyzes its degradation. All proteins and mRNA also undergo spontaneous degradation with a specific lifetime (dashed arrows). (b) Growth of A copy numbers (dashed) peaks and then decreases as it is depleted by repressor R. Initially most R molecules are present in the AR complex, but the number of unbound R molecules increases as A is degraded. Next, the free R peaks and then begins to decrease because not enough A is present to promote its transcription at a rate that is greater than its rate of spontaneous degradation. The cycle then restarts, with the ODE solution producing highly regular oscillations of 25.2 s between A peaks and a 6 s lag between A and R peaks. The stochastic single-particle simulator Smoldyn produces noisier oscillations, but the average behavior is very comparable to the deterministic ODE model, with peak oscillations at 25.9 s and a 6.1 s lag between A and R peaks. (c) After localization of the promoters to the cell center and slowing of DA from 10 to 2 μm2/s, the A molecules become more concentrated in the cell center (red vs. green), which leads to noticeably faster oscillations relative to the nonspatial solution (blue).
