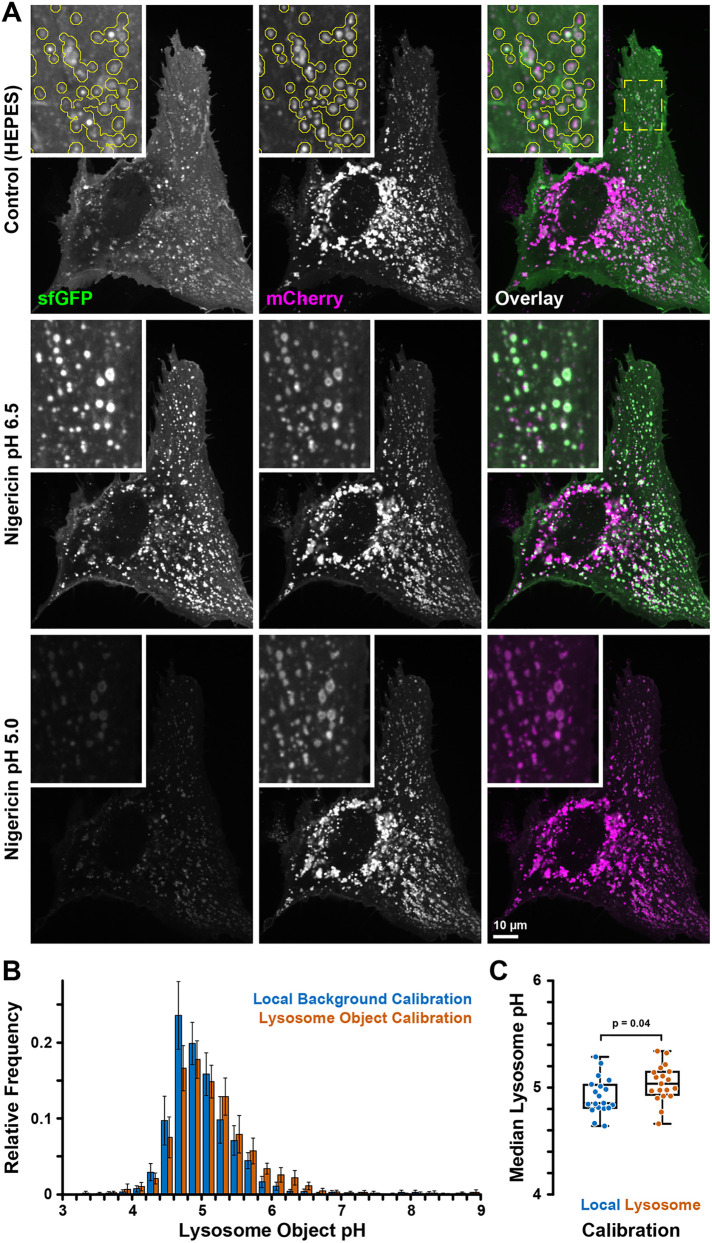
FIGURE 2:
Cell-based pHLARE pH calibration. (A) pHLARE-expressing RPE cell in NaHCO3-containing buffer (described for pHi measurements) and in nigericin buffers of two different calibration pH values showing sfGFP (green) and mCherry (magenta) fluorescence. The three images are scaled identically showing the increase of sfGFP signal in lysosomes at near neutral pH equilibration and the dramatic overall decrease of sfGFP fluorescence at low pH. Insets show the indicated region at higher magnification. The yellow outline in the top row indicates lysosome objects detected in the mCherry channel. Note that lysosome size is near the resolution limit of optical microscopy and pHLARE lysosome membrane localization is only resolved in larger lysosomes. (B) Frequency histogram of lysosome object pH distribution in RPE cells obtained with the two different calibration methods as indicated. Bars are the average of n = 19 cells and error bars indicate 95% confidence interval. (C) Box plot of the median pHlys of the same set of cells. Statistical analysis by unpaired t test.

