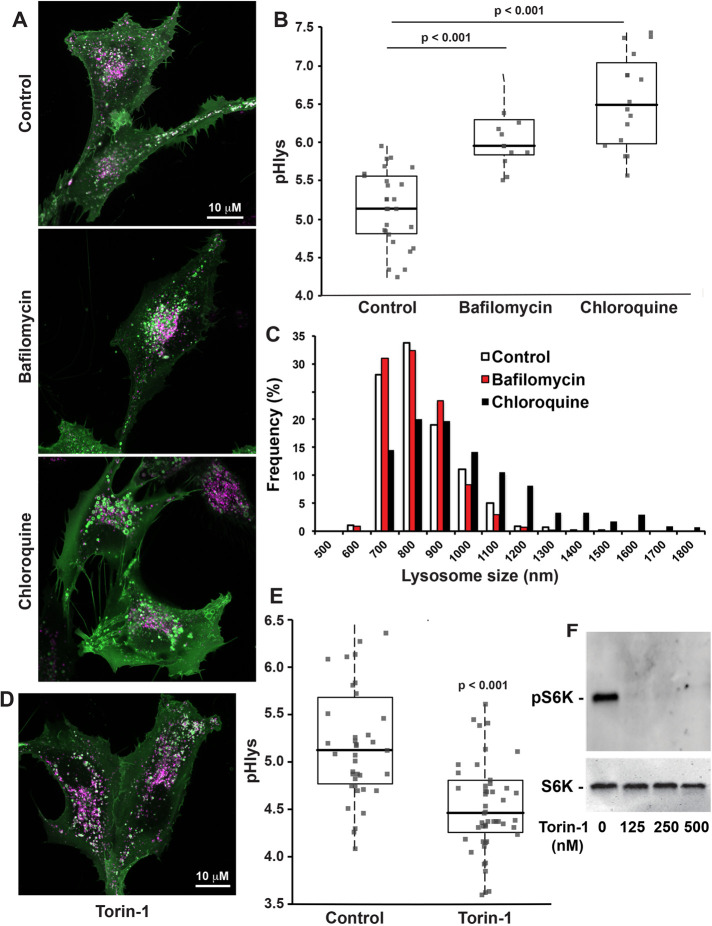
FIGURE 4:
pHLARE measures dynamic changes in pHlys. (A, B) RPE cells stably expressing pHLARE were untreated (control, n = 27 cells) or treated with 100 nM of the V-ATPase inhibitor Bafilomycin A1 (n = 15 cells) or 100 μM chloroquine (n = 15 cells) for 2 h before acquiring images, which were used to calculate pHlys. (C) Lysosome size with indicated conditions determined by measuring more than 1,000 lysosomes in four cell preparations for controls and three cell preparations with bafilomycin and chloroquine treatment. (D, E) pHlys of RPE cells stably expressing pHLARE untreated (control, n = 39 cells) or treated with 250 nM Torin-1 (n = 50 cells) for 2 h before acquiring images. (F) Representative immunoblot of lysates from two separate RPE cell preparations untreated or treated with the indicated concentrations of Torin-1 and probed with antibodies to total and phosphorylated S6K. Box plots show median, first, and third quartile, with whiskers extending to observations within 1.5 times the interquartile range and all individual data points. Statistical analysis by Tukey–Kramer HSD test, with data obtained from three separate cell preparations in B, C, and F and four separate cell preparations in D.

