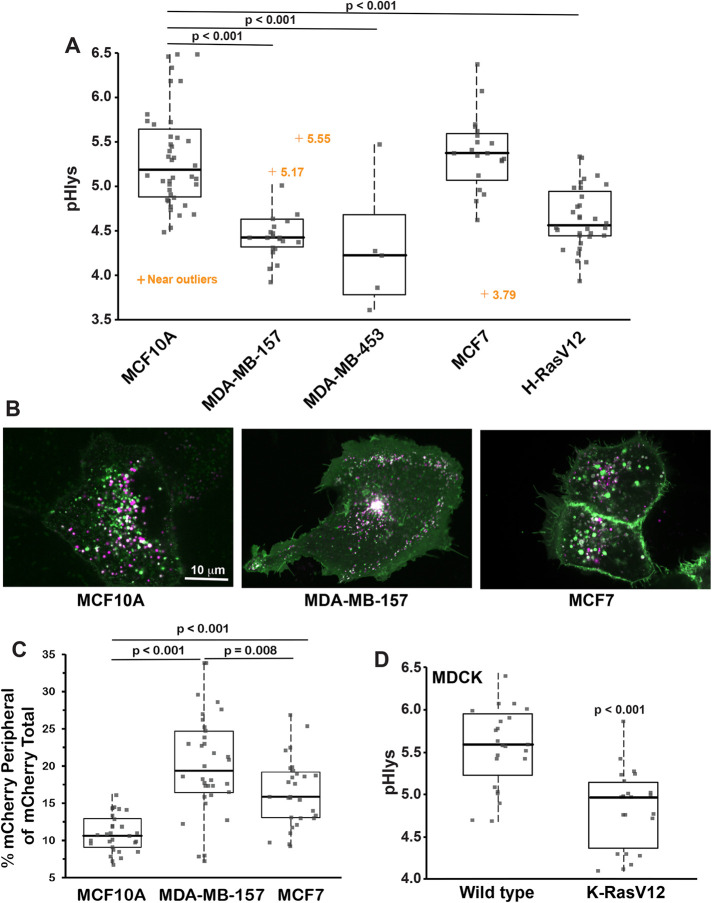
FIGURE 5:
Differences in pHlys in breast cancer cells and with oncogene transformation. (A) The average pHlys of human untransformed MCF10A mammary epithelial cells (n = 36 cells), breast cancer MDA-MB-157 (n = 24 cells), MDA-MB-453 (n = 6 cells), and MCF7 (n = 21) cells, and MCF10A cells stably expressing H-RasV12 (n = 24 cells). (B, C) Representative images of MCF10A, MDA-MB-157, and MCF7 cells expressing pHLARE (B) and quantification of lysosomes within 3 μm of the plasma membrane indicated by mCherry fluorescence. (C, D) The average pHlys in canine MDCK epithelial cells WT (n = 23) and stably expressing K-RasV12 (n = 23 cells). Box plots show median, first, and third quartile, with whiskers extending to observations within 1.5 times the interquartile range and all individual data points. Statistical analysis by Tukey–Kramer HSD test, with data obtained from three to five separate preparations of all cells except for two preparations of MDA-MB-453.

