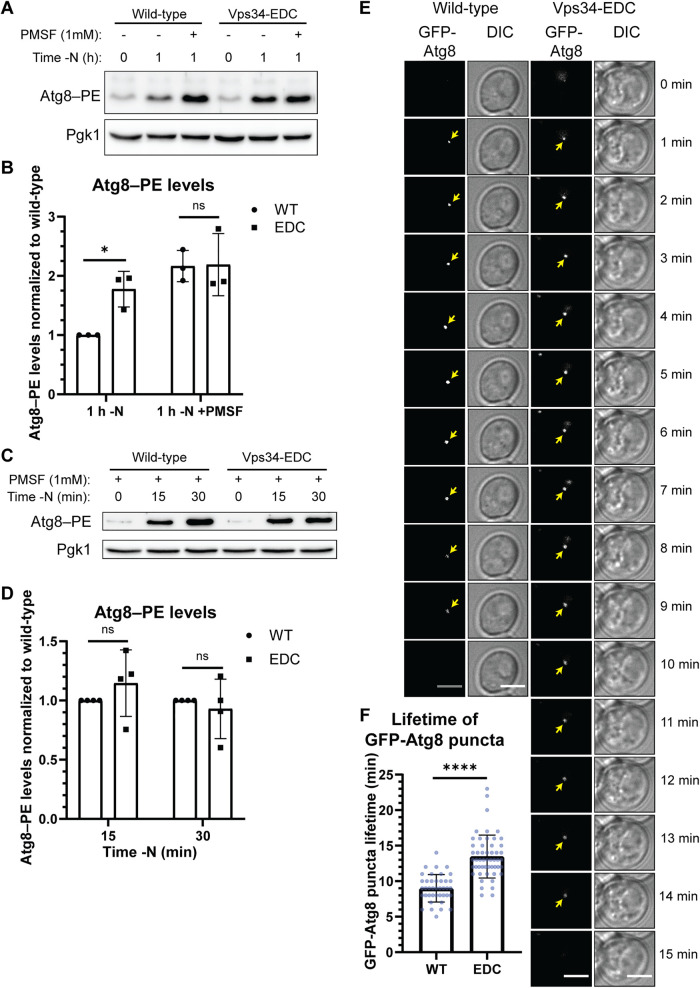
FIGURE 4:
Hyperactive Vps34 inhibits a late step in autophagy. (A, B) Comparison of Atg8–PE protein levels in the absence and presence of PMSF, a protease inhibitor, suggests that Vps34-EDC inhibits a late step in autophagy, but does not change the rate of autophagy induction. During autophagy, the levels of Atg8–PE are determined by both covalent attachment of phosphatidylethanolamine (PE) to Atg8 and by degradation of Atg8–PE once autophagosomes fuse with the vacuole. When degradation of Atg8–PE is inhibited by the serine protease inhibitor, PMSF, there was no difference in Atg8–PE levels in Vps34-WT compared with Vps34-EDC, suggesting that autophagy induction is unchanged by Vps34-EDC. However, in the absence of PMSF, Atg8–PE protein levels are elevated by hyperactive Vps34-EDC following 1 h of nitrogen starvation, suggesting that Vps34-EDC inhibits a late step in autophagy. vps34Δ cells were transformed with pRS416-Vps34 or pRS416-Vps34-EDC. Atg8–PE protein levels were analyzed via Western blot using anti-Atg8 antibody. Atg8–PE levels were normalized to Pgk1. Levels were further normalized to wild-type at 1 h of nitrogen starvation. Representative of n = 3. Error bars indicate SD. Unpaired t test. ns = p > 0.05, * = p < 0.05. (C, D) Following 15 and 30 min of nitrogen starvation, Atg8–PE protein levels are unchanged between hyperactive Vps34-EDC and wild-type when degradation of Atg8–PE is inhibited by the protease inhibitor, PMSF. This result suggests that Vps34-EDC does not affect autophagy induction. vps34Δ cells were transformed with pRS416-Vps34 or pRS416-Vps34-EDC. Atg8–PE protein levels were analyzed via Western blot using anti-Atg8 antibody. Atg8–PE levels were normalized to Pgk1. Levels were further normalized to wild-type at 15 and 30 min following nitrogen starvation. Representative of n = 4. Error bars indicate SD. Unpaired t test. ns = p > 0.05. (E, F) Hyperactive Vps34-EDC results in an increase in the lifetime of GFP-Atg8 puncta in cells. vps34Δ cells were cotransformed with pRS414-GFP-Atg8 and pRS416-Vps34 or pRS416-Vps34-EDC. Cells were imaged every minute for 26 min following 30 min of nitrogen starvation. Twenty z-slices that were 0.2 µm apart were acquired at each time point. Single z-slice. DIC, differential interference contrast. Scale bar = 3.5 µm. GFP-Atg8 puncta were tracked over time with the lifetime of each puncta calculated as the time between the first and last frames the puncta were visible. Only GFP-Atg8 puncta that could be followed unambiguously over their lifetime were analyzed. For wild-type, n = 40. For Vps34-EDC, n = 52. Error bars indicate SD. Unpaired t test. **** = p < 0.0001.

