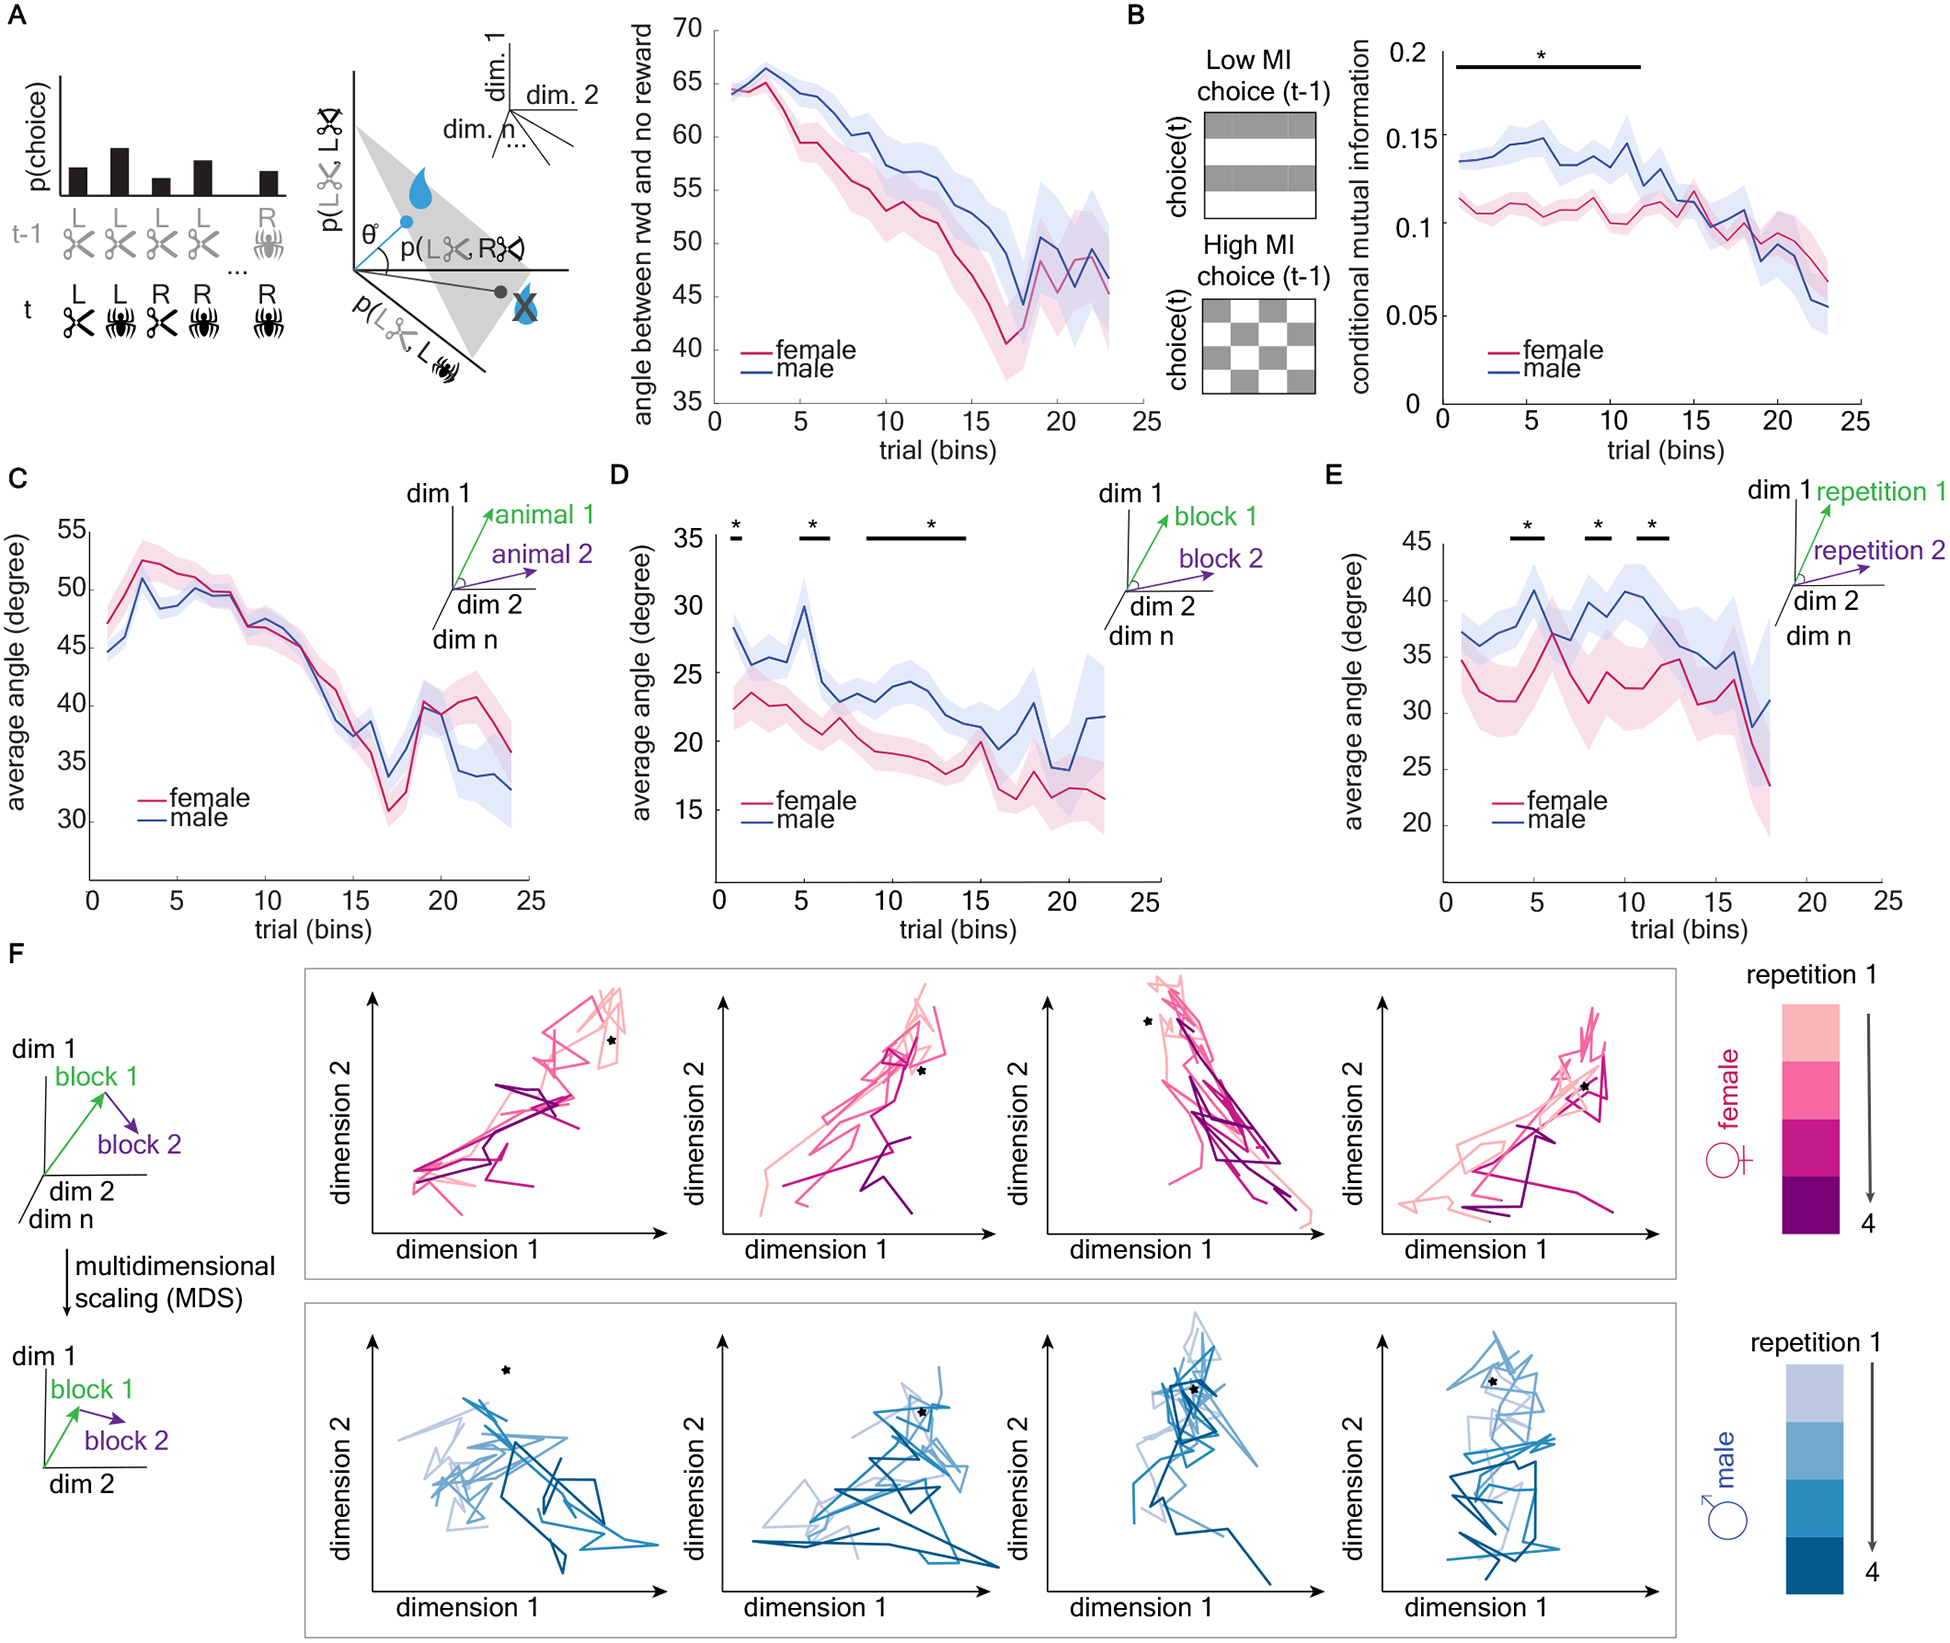
Figure 4. Male mice were more likely to differ from themselves over time, with choice patterns dependent on past outcomes.

A) Comparing choice strategies as vector angles. Left) We calculate the joint probability distribution of all possible choices at time t (image x side) and all previous choices at t-1. This probability distribution can be thought of as a vector on the probability = 1 simplex (middle). We then compare choice strategies by measuring the angle between choice strategy vectors, here between strategy vectors following a reward and following no reward. Right) Average angle between choice strategy vectors following reward and no reward, plotted separately for males (blue) and females (pink). See also Figure S3. B. Left) If choice on trial t is independent of choice on the previous trial (t-1), mutual information will be low. Conversely, if choice t depends on t-1, mutual information will be high. Right) Conditional mutual information is higher in males, indicating that responses are more dependent on the previous trial variables than they are in females. C). Average angle between choice strategy vectors between animals within sex. D) Average angle between choice strategy vectors within animals across trial bins See also Figure S4. E) Average angle between choice strategy vectors within animals across repetitions of the task. F) Multidimensional scaling (MDS) was used to reduce the dimensionality of the strategy space in order to visualize each animal’s strategy paths. Each graph is a different animal, with the colors representing repetitions of the task. The star represents the optimal strategy for each projection (i.e. the choice pattern that only repeats high value image). Note that the strategy paths of both sexes are approaching the optimal strategy point. See also Figure S5. Data shown as bins of 150 trials. * indicates p < 0.05. Graphs depict mean ± SEM.
