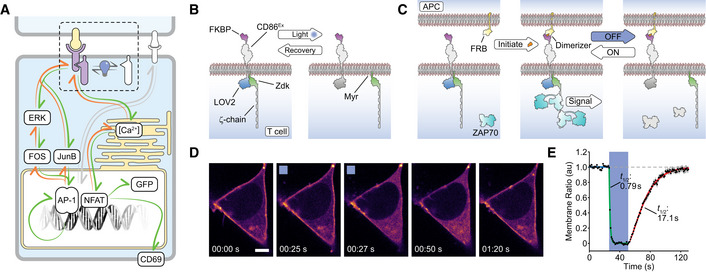
Figure 1. Construction of an optically modulated chimeric antigen receptor (OptoCAR) in T cells.

- Schematic showing the OptoCAR replacing the antigen receptor (dotted region) as the primary driver of intracellular T‐cell signaling. Illumination of the cells leads to the dissociation of the intracellular signaling domain of the OptoCAR complex and the loss of signal transduction. The network nodes investigated in this study are explicitly depicted within the boxes.
- A more detailed schematic of the bipartite OptoCAR complex from (A) with component parts labeled. Light‐mediated disruption causes dissociation of intracellular signaling tail (ζ‐chain) from the extracellular binding domain.
- OptoCAR‐T cell engagement with an antigen‐presenting cell (APC) does not initiate signaling in the absence of the dimerizer small molecule. OptoCAR signaling from within these cell conjugates is modulated by transitioning from the dark (signaling‐competent) state to the “Off” state by illuminating cells with blue light. The intracellular domain will be rapidly dephosphorylated when it diffuses away from the bound OptoCAR.
- Stills from Movie EV1 showing the membrane‐bound form of the OptoCAR expressed in HEK293T cells being reversibly dissociated from the extracellular domain by single‐cell illumination (blue box). The intracellular part of the OptoCAR used in this experiment was not myristoylated so it localized to the cytoplasm on dissociation, to aid visualization of OptoCAR dynamics. Scale bar: 5 μm.
- Quantification of the light‐mediated dissociation of OptoCAR in HEK293T cells by measuring the ratio of membrane‐bound intracellular part of OptoCAR over time. Individual cells were illuminated after 25 s of imaging for 25 s to calculate dissociation rate (green) before returning to dark (signaling‐competent) state to calculate re‐association rate (red line). A unitary value was assigned to the mean membrane fluorescence prior to illumination and zero to the minimum value. Raw plots are presented in Appendix Fig S1. Bounding area around data points shows mean ± SEM (n = 12 cells).
