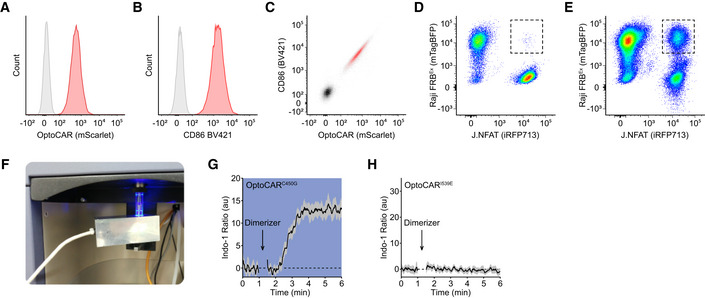
Figure EV1. Quantifying the intracellular Ca2+ flux in conjugated OptoCAR‐T cells. Related to Fig 2 .

-
A–CFlow cytometry data of Jurkat T cells either untransduced (gray) or expressing the OptoCAR construct (red) after lentiviral transduction. The distribution of mScarlet fluorophore genetically fused to OptoCAR is shown (A), along with surface staining for the receptor using an anti‐CD86 antibody (B). The bivariate plot of these two distributions shows that they are extremely well‐correlated (C), demonstrating mScarlet intensity is a good marker for OptoCAR cell surface expression.
-
D, EConjugates formed between Jurkat (J.NFAT; iRFP713+) and Raji‐FRBEx cells (mTagBFP+) can be directly gated on during acquisition of flow cytometry data. Simply mixing the two cell types together produces essentially no double‐positive events (D), but allowing them to interact at high density at 37°C for 10 min creates a distinct and readily observable population of cell conjugates (E).
-
FPhotograph of the custom‐built illumination device that can expose the sample to blue light while maintaining it at 37°C on the flow cytometer.
-
G, HRepeating the Ca2+ flux assay described in the main text with a variant of the LOV2 domain in the OptoCAR that is unresponsive to blue light illumination (OptoCARC450G) drives increased intracellular [Ca2+] independently from the illumination state of the sample (G). Bounded line shows mean ± SEM (n = 3). Conversely, the complementary mutation of the LOV2 domain that maintains it in the “light” state (OptoCARI539E) cannot drive signaling even in the dark (H). Bounded line shows mean ± SEM (n = 4).
