-
A
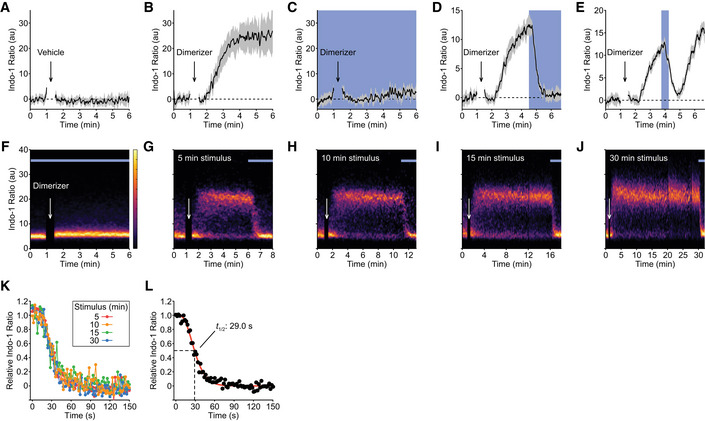
OptoCAR‐T cells were loaded with a ratiometric Ca2+ indicator (Indo‐1) before conjugation with ligand‐presenting cells. Conjugated cells were gated on by flow cytometry and the Indo‐1 ratio, as a readout of intracellular [Ca2+] was measured over time. Vehicle addition after 60 s caused no detectable change in this ratio. Bounded line shows mean ± SEM (n = 5).
-
B
An equivalent experiment was set up as in (A), but now 2 μM dimerizer was added after 60 s. Conjugated cells were maintained in the dark to maintain OptoCAR signaling. Bounded line shows mean ± SEM (n = 3).
-
C
An equivalent experiment was set up as in (B), but the conjugated cells were continuously illuminated throughout dimerizer addition to disrupt OptoCAR signaling. Bounded line shows mean ± SEM (n = 3).
-
D
An equivalent experiment was set up as in (B), but now conjugated cells were illuminated 3.5 min after dimerizer addition. Bounded line shows mean ± SEM (n = 4).
-
E
An equivalent experiment was set up as in (B), but now cells were illuminated 165 s after dimerizer addition, for 30 s. Bounded line shows mean ± SEM (n = 3).
-
F–J
Representative density plots of Ca2+ flux from conjugated OptoCAR‐T cells over time at 37°C. Conjugated cells were stimulated with dimerizer addition for 0 (F), 5 (G), 10 (H), 15 (I), or 30 (J) minutes prior to disrupting signaling by illuminating cells.
-
K
The decrease in intracellular [Ca2+] on illuminating conjugated cells after different intervals during activation was plotted as the mean Indo‐1 ratio (n = 3). The relative [Ca2+] was calculated by removing background Indo‐1 ratio before scaling to maximal output. Inset legend delineates the datasets.
-
L
A single plot combining all datasets from (K) was fit by the survival function of a gamma distribution, with indicated half‐life calculated from the time taken for the relative [Ca2+] to decrease to 50% of maximum.

